


The U.S. apartment industry has entered what benchmarking analysts now call a cost-efficiency phase: rent growth has flattened while operating expenses climbed to about $8,657 per unit in 2024, and owners keep just 7 cents of every rent dollar as profit. In that math, every controllable line item matters, and waste is one of the few an operator can actually move.
Key Takeaways
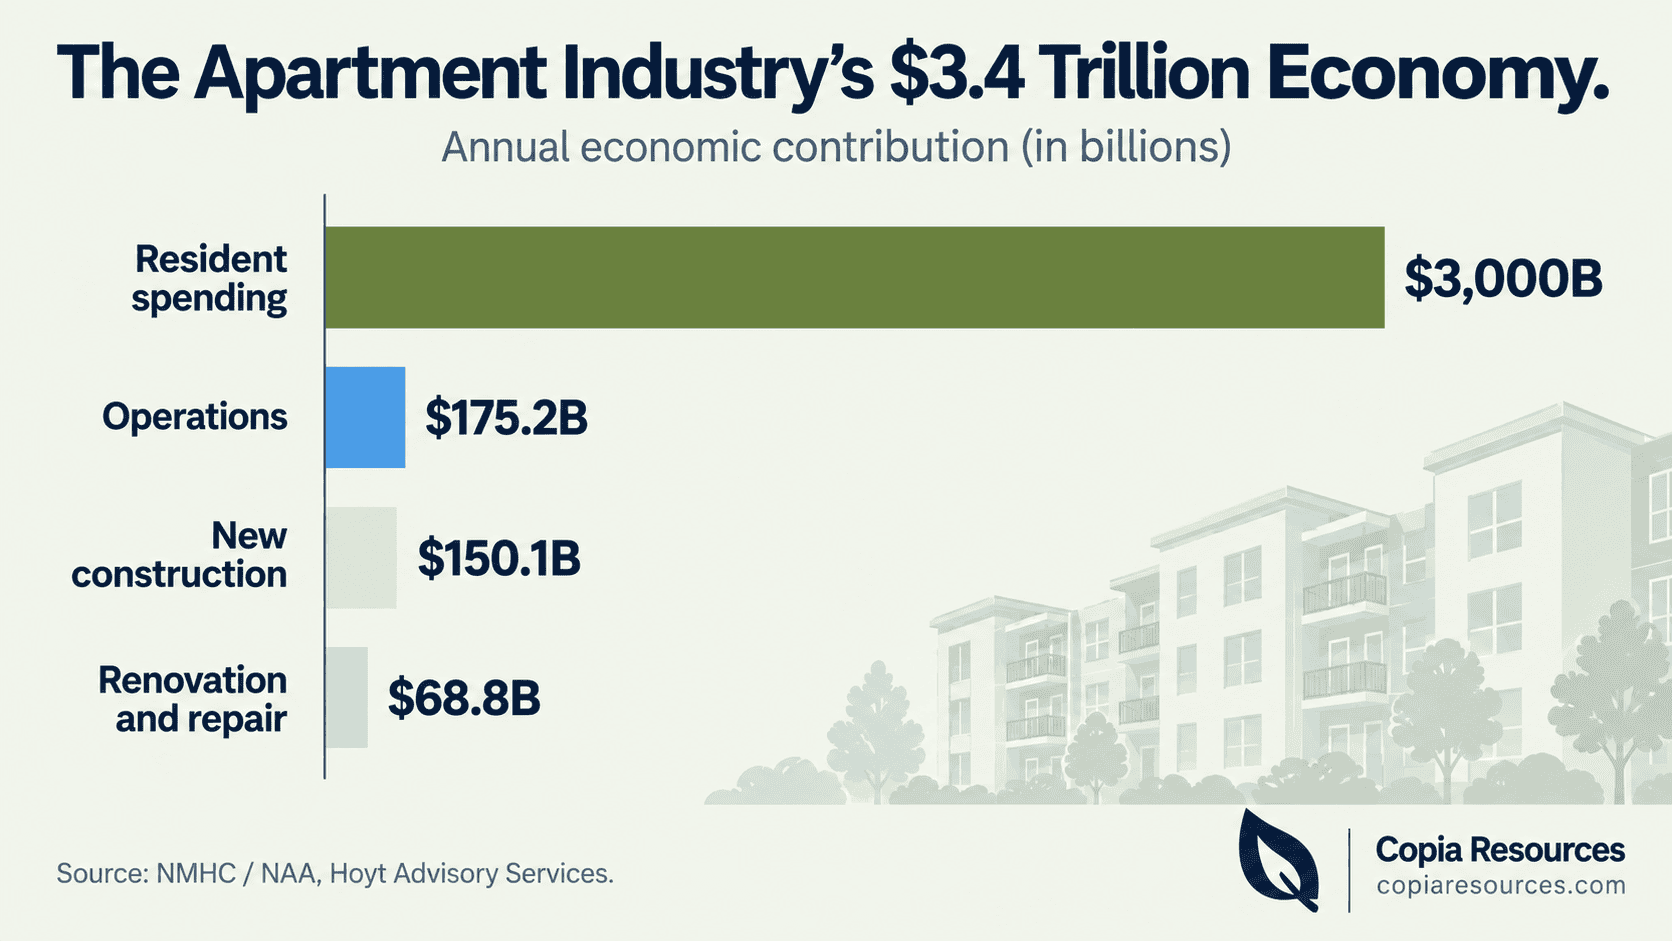
- The apartment industry and its residents contribute more than $3.4 trillion to the U.S. economy each year.
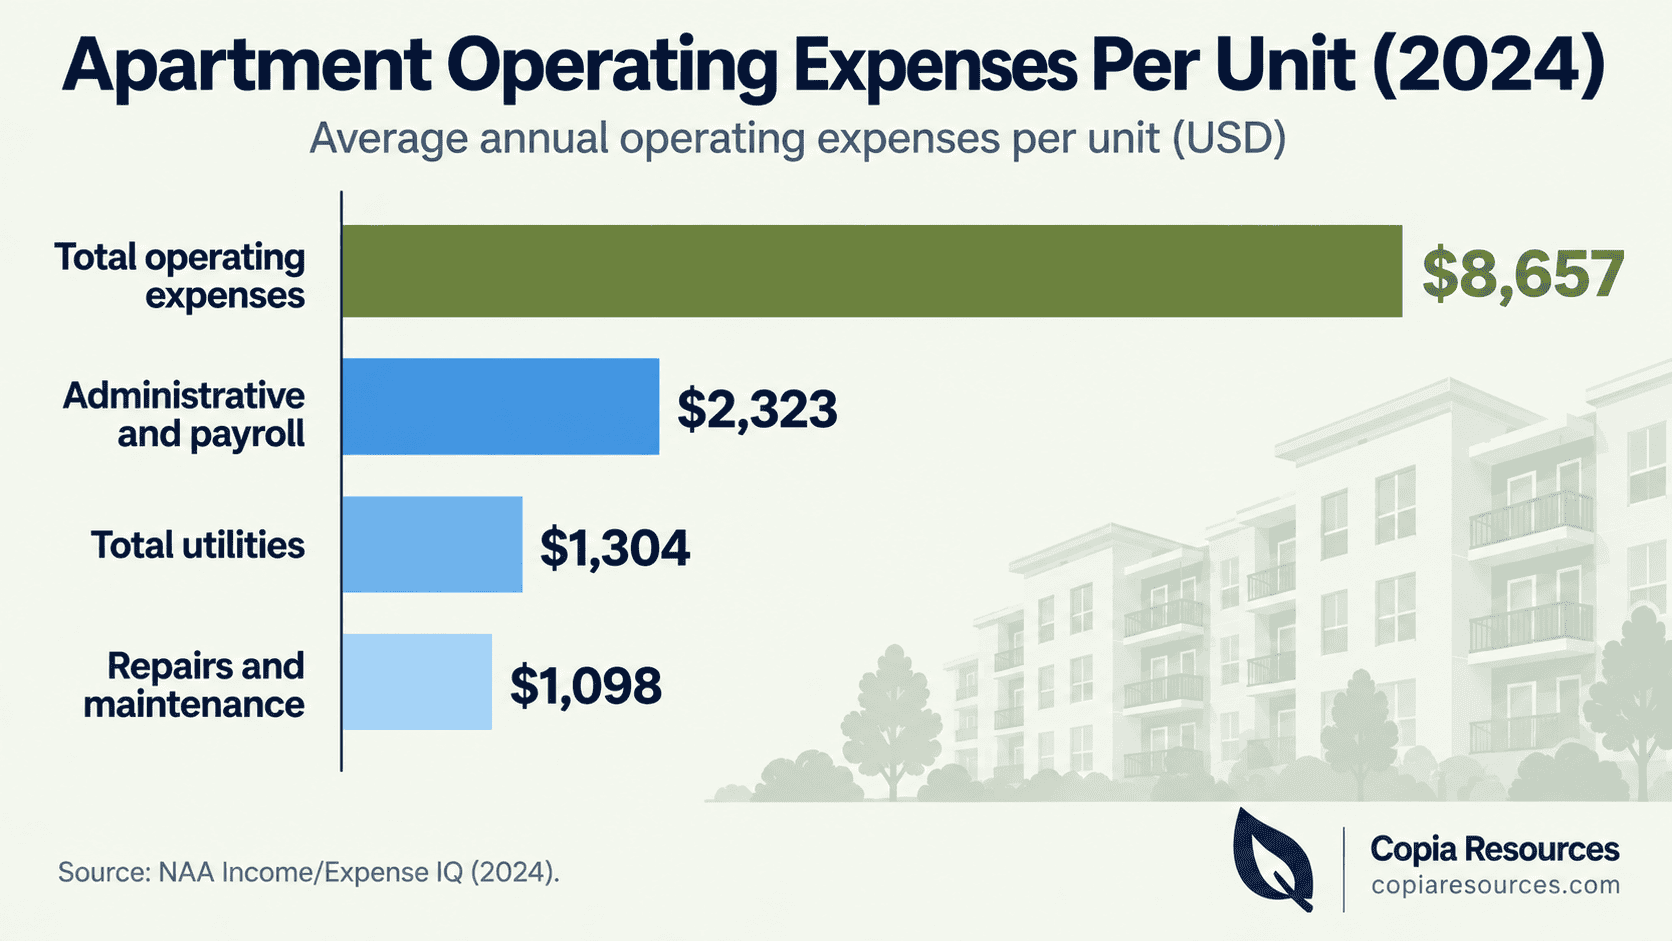
- Total apartment operating expenses reached about $8,657 per unit in 2024, up 2.2 percent year over year.
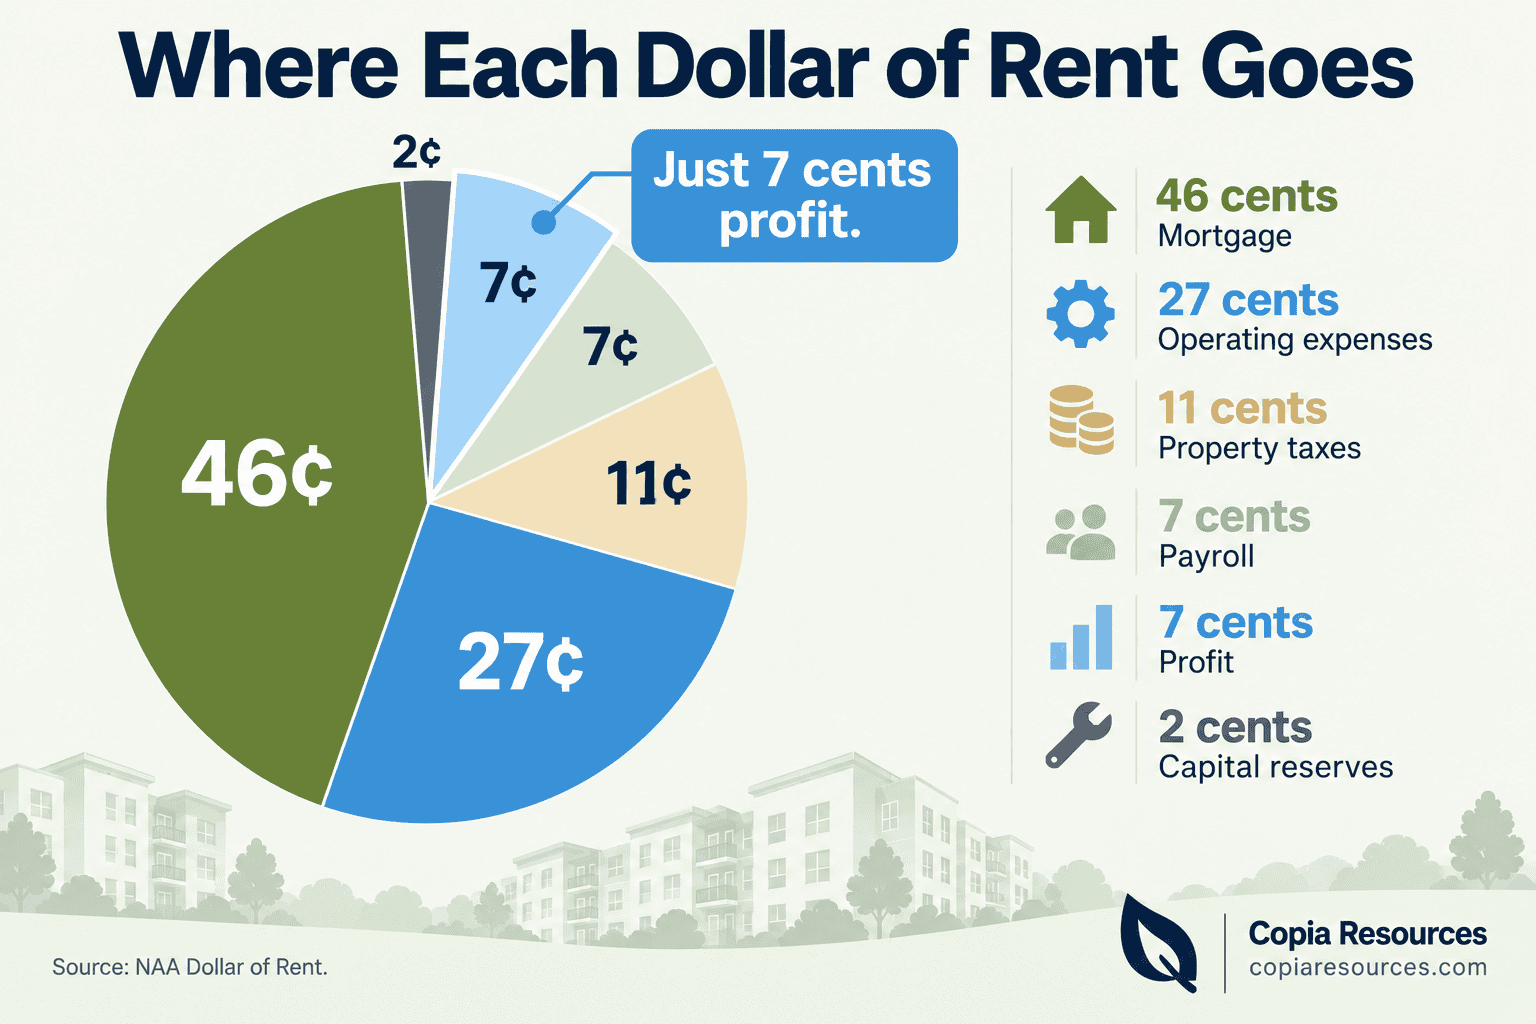
- About 93 cents of every rent dollar goes to costs, leaving roughly 7 cents of profit.
- Operations spending alone in the apartment sector contributes about $175.2 billion annually.
- The multifamily vacancy rate was about 4.1 percent in Q2 2025, signaling strong demand.
- The U.S. needs an estimated 4.3 million more apartments by 2035 to meet demand.
- With margins this thin, cost control, not rent growth, is where 2025-2026 performance is being decided.
What’s in This Guide
1The Size of the Apartment Industry
The multifamily sector is not a niche corner of real estate. It is a major economic engine, and understanding its scale frames why operational efficiency matters at the property level.
The industry’s total contribution works out to more than $9.3 billion a day. Beyond resident spending, the operations side, the day-to-day running of communities, contributes $175.2 billion on its own, with new construction adding $150.1 billion and renovation and repair another $68.8 billion. More than one-third of Americans now rent their housing, and apartments are central to how the country lives.
Source: NMHC economic contribution report | NAA economic impact data
See Waste Solutions for Multi-Family Communities
2Demand, Vacancy, and Supply
The demand picture explains why owners can hold occupancy but cannot simply raise rents to cover rising costs. The market is full, but it is also flooded with new supply.
Demand is strong: vacancy near 4 percent is tight by historical standards, and Q2 2025 set a record for second-quarter absorption. At the same time, the construction pipeline delivered the most new apartments in nearly four decades, and roughly 94 percent of recent multifamily starts were rental rather than condo. The result is a market where buildings fill but new supply caps rent growth, so the only reliable lever left for net operating income is the expense side.
Why this matters for operators:When rent growth stalls but demand stays high, the properties that outperform are the ones that run leanest. The 4.3 million-unit shortfall guarantees long-term demand, but it does nothing for this year’s margins. That is decided on the cost line.
Source: NMHC Apartment Industry Quick Facts
See the Full Waste Management Statistics for 2026
3Operating Costs Per Unit
The clearest window into property economics is the per-unit expense benchmark. The NAA Income/Expense IQ report, built from more than 1 million units across 4,600-plus properties, is the industry’s most comprehensive source.
The 2024 benchmarks tell a consistent story: expenses rising from a permanently higher base. Administrative and payroll costs reached $2,323 per unit, up 3.81 percent and nearly 20 percent higher than 2021. Utilities were the one category that declined, down 3.2 percent, driven by lower natural gas and heating fuel, though water and sewer kept climbing at 5.1 percent. NAA’s own analysis concluded the market “has fully entered a cost-efficiency phase of the operating cycle, where controlling expenses is essential to maintaining performance.”
| Expense Category (per unit, 2024) | Amount | Year-over-Year |
|---|---|---|
| Total operating expenses | $8,657 | +2.2% |
| Administrative and payroll | $2,323 | +3.81% |
| Total utilities | $1,304 | -3.2% |
| Repairs and maintenance | $1,098 | +3.7% |
Source: NAA 2024 Income/Expense IQ analysis
Bring Structure to Your Trash Service Costs
4The Thin-Margin Reality
The single most important number for understanding why cost control dominates property management decisions is the profit margin. It is much thinner than most people assume.
NAA’s Dollar of Rent research breaks down where the money goes: 46 cents to the mortgage, 27 cents to operating expenses like maintenance, insurance, and utilities, 11 cents to property taxes, 7 cents to payroll, and 2 cents to capital reserves. That leaves 7 cents of profit. Rental housing, as NAA puts it, is a narrow-margin industry.
Where Each Dollar of Rent Goes
Source: NAA Dollar of Rent analysis
Myth: “Cutting a waste overcharge is too small to matter.”At a 7-cent margin, the opposite is true. When profit is 7 percent of revenue, a dollar of avoided cost contributes far more to the bottom line than a dollar of new rent, because the rent dollar still has to pass through all those expense layers. Recovering an overcharge or eliminating a contamination fee drops almost entirely to the owner’s profit line. On thin margins, expense recovery is one of the highest-return moves available.
Source: NAA Dollar of Rent analysis
5Where Waste Fits in the Budget
Waste and trash service is not a headline expense category, which is exactly why it is so often overlooked, and overpaid. But it sits inside the operating-cost line that NAA flags as the operator’s primary lever.
In NAA’s benchmarking, trash service is categorized under utilities, the $1,304-per-unit line. Unlike the mortgage or property taxes, which are largely fixed, waste cost is genuinely controllable: it depends on container sizing, pickup frequency, contamination, and whether the property is being billed for service it does not need. Those are all variables an operator can adjust, which makes waste one of the few line items where active management produces savings rather than just slower increases.
Copia Resources Analysis: Why Waste Is a High-Return Line ItemThree industry facts stack into a clear conclusion. First, owners keep about 7 cents of every rent dollar in profit (NAA). Second, the market is in a cost-efficiency phase where expense control, not rent growth, drives performance (NAA). Third, waste cost lives in the controllable operating-expense layer, dependent on right-sizing, frequency, and contamination, not fixed like debt or taxes. Put together: trimming waste overcharges and contamination fees is a rare expense lever that an operator fully controls and that flows almost entirely to profit. That is why quarterly bill audits and contamination control are not housekeeping, they are margin protection. Calculation and interpretation original to Copia Resources, based on NAA benchmarking data.
This is the operational core of what Copia Resources does for property managers: right-size service to actual need, audit hauler invoices for overcharges, and keep contamination low so recycling stays a credit rather than a surcharge. On a 7-cent margin, that work pays for itself.
Source: NAA Income/Expense IQ analysis
Request a Quote for Valet Trash Service
6California’s Added Cost Layer
For property managers operating in California, the cost-control picture comes with a compliance dimension that does not exist in most other states.
California’s SB 1383 requires multi-family and commercial properties to provide organics collection and keep contamination down, with annual route audits and the possibility of penalties for noncompliance since January 1, 2024. AB 341 and AB 1826 add commercial recycling and organics requirements on top. For a California operator already managing the tightest margins in years, waste is simultaneously a cost to control and a compliance obligation to meet, which makes getting the program right doubly valuable. The same well-run waste system that keeps costs down also keeps the property out of regulatory trouble.
Source: CalRecycle SB 1383 program
See Food Waste Statistics and SB 1383 Data for 2026
Property Management Industry Statistics 2026: Summary Table
| Statistic | Figure | Source | Year |
|---|---|---|---|
| Apartment industry economic contribution | $3.4 trillion/year | NMHC / NAA | 2024 |
| Daily economic contribution | $9.3 billion | NMHC / NAA | 2024 |
| Operations sector contribution | $175.2 billion | NMHC / NAA | 2024 |
| Americans living in apartments | ~39 million | NMHC / NAA | 2024 |
| Total operating expenses per unit | $8,657 | NAA I/E IQ | 2024 |
| Operating expense increase | +2.2% | NAA I/E IQ | 2024 |
| Administrative and payroll per unit | $2,323 | NAA I/E IQ | 2024 |
| Total utilities per unit | $1,304 | NAA I/E IQ | 2024 |
| Repairs and maintenance per unit | $1,098 | NAA I/E IQ | 2024 |
| Costs per dollar of rent | 93 cents | NAA Dollar of Rent | 2023 |
| Profit per dollar of rent | 7 cents | NAA Dollar of Rent | 2023 |
| Mortgage share of rent dollar | 46 cents | NAA Dollar of Rent | 2023 |
| Operating expense share of rent dollar | 27 cents | NAA Dollar of Rent | 2023 |
| Multifamily vacancy rate | ~4.1% | Industry market data | Q2 2025 |
| Net units absorbed (record Q2) | 188,200 | Industry market data | Q2 2025 |
| Apartments needed by 2035 | 4.3 million | NMHC / NAA | 2035 proj. |
| Existing apartment deficit | ~600,000 | NMHC / NAA | 2024 |
| Share of Americans who rent | More than 1/3 | NMHC / NAA | 2024 |
| SB 1383 organics reduction (CA) | 75% by 2025 | CalRecycle | 2025 target |
Frequently Asked Questions
How big is the U.S. apartment industry?
What are average apartment operating expenses per unit?
How much profit do apartment owners actually keep?
What is the apartment vacancy rate in 2025?
How many more apartments does the U.S. need?
Methodology and Sources
About This Data
Industry size and demand figures come from the National Multifamily Housing Council (NMHC) and National Apartment Association (NAA), including the Hoyt Advisory Services economic contribution study. Per-unit operating cost benchmarks come from the NAA Income/Expense IQ report, built with IREM and BOMA from 2024 operating data covering more than 1 million units. The rent-dollar breakdown comes from NAA’s Dollar of Rent analysis. California compliance figures come from CalRecycle. Market figures are dated to their reporting period.
Primary sources:
- National Multifamily Housing Council and National Apartment Association, The Contribution of Multifamily Housing to the U.S. Economy (Hoyt Advisory Services)
- NAA Income/Expense IQ benchmarking report (2024 data, with IREM and BOMA)
- NAA Dollar of Rent analysis
- NMHC Apartment Industry Quick Facts and market conditions data
- CalRecycle, SB 1383 program
Media and press usage: Journalists and publishers are welcome to cite these statistics with attribution to the original primary sources named above and a link to this page. For questions about controlling waste costs at multi-family and commercial properties, contact Copia Resources.
See the Latest Recycling Statistics for 2026