

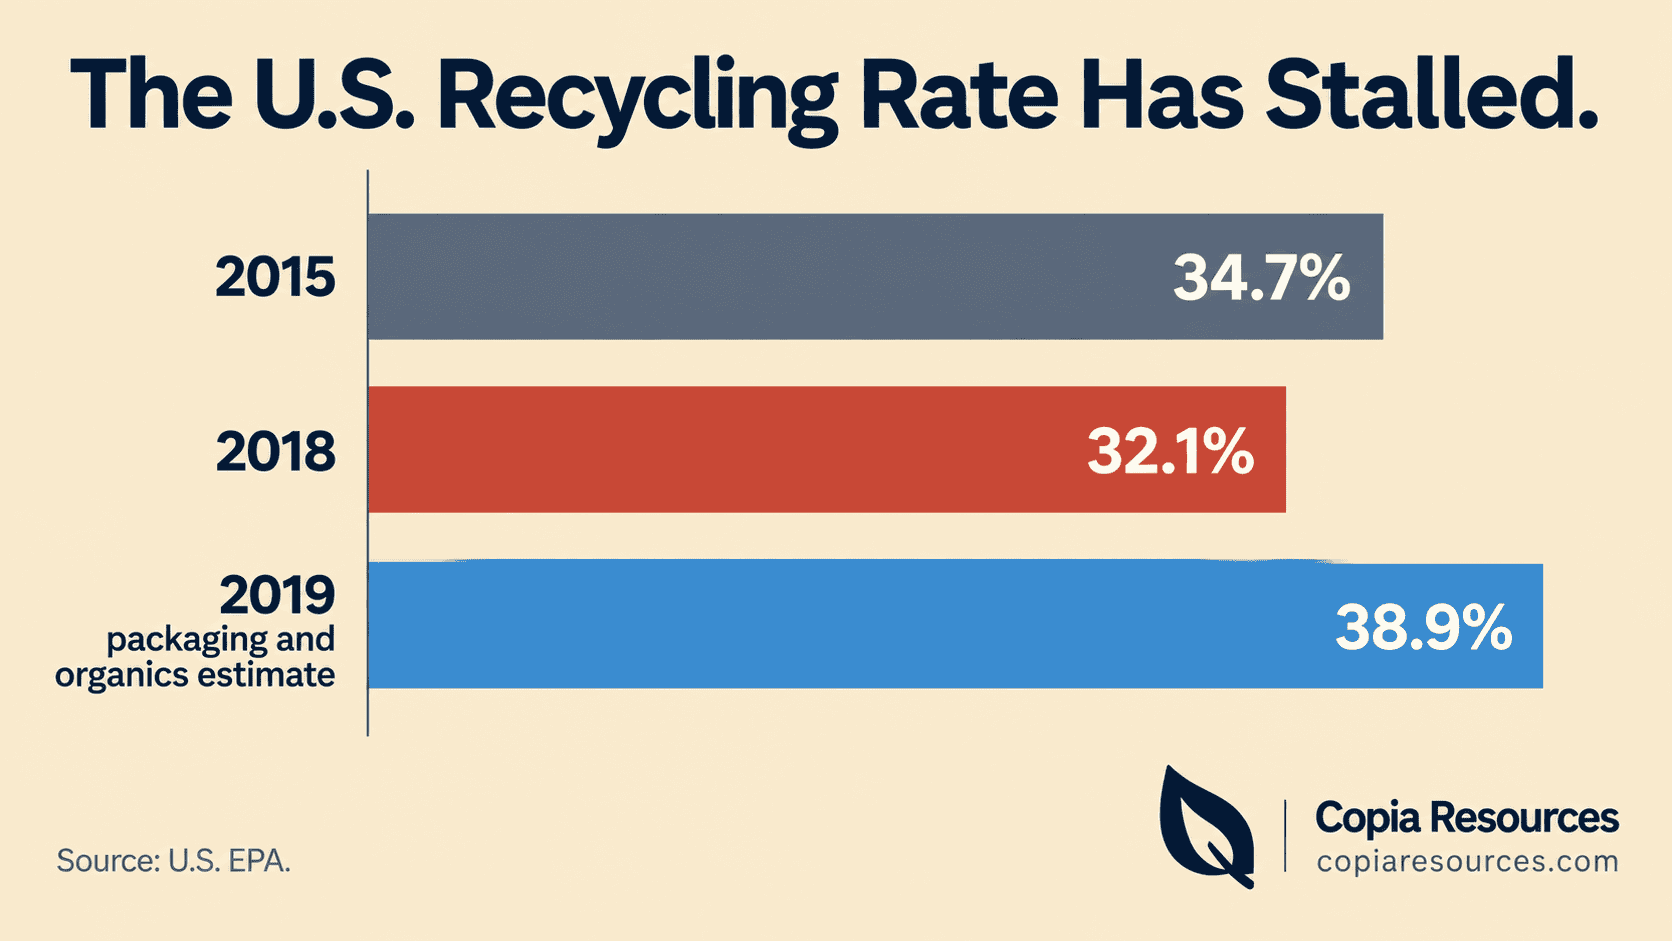
The United States recycled and composted just 32.1 percent of its municipal solid waste in 2018, and that rate had actually fallen from 34.7 percent three years earlier. Behind the single national number is a wide gap between materials that get recycled almost every time and materials that almost never do, a gap that decides whether a property’s recycling bin saves money or quietly costs it.
Key Takeaways
- The U.S. recycling and composting rate was 32.1 percent in 2018, down from 34.7 percent in 2015.
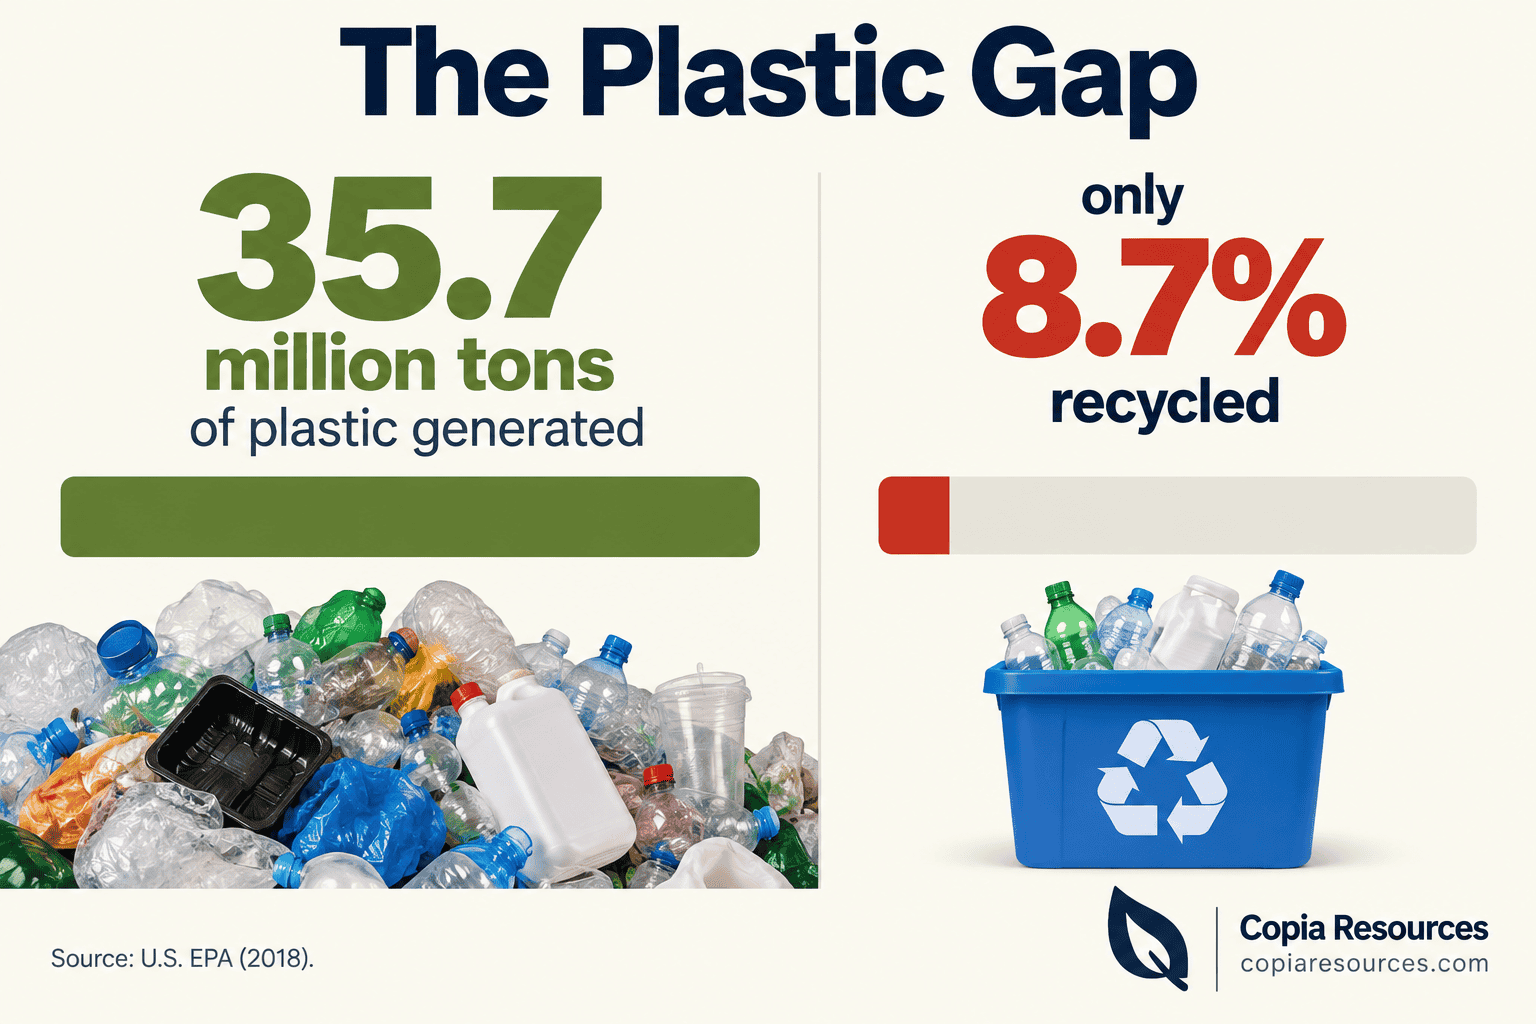
- Corrugated cardboard is recycled at 96.5 percent, while plastics overall sit near 8.7 percent.
- Paper and paperboard make up about 67 percent of everything that gets recycled in the U.S.
- Contamination at materials recovery facilities commonly runs 15 to 25 percent, sending otherwise recyclable loads to the landfill.
- China’s 2018 National Sword policy set a 0.5 percent contamination limit and reshaped U.S. recycling economics.
- A newer EPA assessment using 2019 data estimated a 38.9 percent rate for commonly recycled packaging and organics, with room to reach 61 percent.
- Single-stream systems experience far more contamination than separated, multi-stream collection.
What’s in This Guide
1The U.S. Recycling Rate
The headline recycling number comes from the EPA’s Advancing Sustainable Materials Management report, whose most recent complete dataset covers 2018. It is the figure most often cited, and it tells a story of stalled progress.
In raw tonnage, about 69 million tons were recycled and 25 million tons composted in 2018, together nearly 94 million tons of material kept out of landfills. That is roughly 2.8 times what was diverted in 1990, so the long arc is upward even though the rate slipped in the late 2010s.
A newer EPA effort offers a second lens. The agency’s Assessment of the U.S. Recycling System, using 2019 data for commonly recycled packaging and organic materials, estimated a recycling rate of about 38.9 percent for those specific materials. The two numbers measure slightly different things, the 32.1 percent covers the whole municipal stream, the 38.9 percent covers the packaging and organics that have real end markets, but both point to the same conclusion: a large majority of recyclable material is still not being recovered.
Two valid numbers, one takeaway:Whether you use the EPA’s 32.1 percent whole-stream figure or its newer 38.9 percent packaging-and-organics estimate, well over half of recoverable material is still going to landfill. For a property, the gap between “set out for recycling” and “actually recycled” is where contamination fees live.
Source: U.S. EPA National Overview | U.S. EPA Recycling Infrastructure Assessment
See Copia’s Waste and Recycling Services
2Recycling Rates by Material
The single national rate hides enormous variation. Some materials are recycled at rates approaching universal recovery, while others almost never make it into a new product. The difference comes down to end markets, how easy a material is to sort, and whether it holds its value through reprocessing.
Paper and paperboard do the heavy lifting in U.S. recycling, accounting for roughly 67 percent of everything recycled by weight. Metals contribute about 13 percent, while glass, plastic, and wood each make up between 4 and 5 percent of the recycling total. Corrugated boxes alone, the brown boxes from online shopping, accounted for 32.1 million tons of recycled material in 2018.
U.S. Recycling Rates by Material (2018)
Source: U.S. EPA, Advancing Sustainable Materials Management (2018 data)
| Material | Recycling Rate (2018) | Why |
|---|---|---|
| Corrugated cardboard | 96.5% | Strong end markets, easy to bale |
| Paper and paperboard (all) | 68.2% | Established mills and demand |
| Newspaper / mechanical papers | 64.8% | Long-standing recovery streams |
| Aluminum cans | 50.4% | High scrap value, infinitely recyclable |
| Glass containers | 31.3% | Heavy, breaks, weak local markets |
| PET plastic bottles | 29.1% | Recyclable but inconsistent capture |
| Plastics (all types) | 8.7% | Most types lack end markets |
Source: U.S. EPA Containers and Packaging Data | U.S. EPA Aluminum Material Data
See the Full Waste Management Statistics for 2026
3The Plastic Problem
No material illustrates the gap between perception and reality like plastic. Most people assume the plastic in their recycling bin gets recycled. The data says otherwise.
Plastics generation has climbed from 8.2 percent of the waste stream in 1990 to 12.2 percent in 2018. Yet recycling has not kept pace, for two structural reasons. First, most plastic types, the mixed numbers 3 through 7, have little to no end market, so processors often have to pay to move them rather than sell them. Second, plastic degrades each time it is reprocessed, so unlike glass or metal it can usually be recycled only once or twice before the polymers break down.
Myth: “All plastics with a recycling symbol are recyclable in my bin.”The resin code (the number inside the triangle) identifies the plastic type, it does not guarantee your local program accepts it. In practice, PET bottles (number 1) and HDPE bottles (number 2) are the most widely accepted, while many plastics numbered 3 through 7 are not recyclable curbside in most communities. Putting them in the bin anyway is a leading cause of contamination, the exact problem that triggers fees and gets loads rejected.
For property managers, plastic film is the bigger operational headache. Plastic bags and wrap are among the top contaminants at sorting facilities because they tangle equipment, and they are not accepted in most curbside recycling. Keeping film out of recycling bins is one of the highest-impact contamination fixes available.
Source: U.S. EPA Recycling Common Recyclables | U.S. EPA National Overview
Recycling Programs Built for Multi-Family Properties
4Contamination: The Hidden Cost
Contamination is the most important recycling statistic that property managers rarely see on a report, until it shows up as a surcharge on the hauler bill. It happens when non-recyclable material, or recyclable material spoiled by food and liquids, ends up mixed into a recycling load.
The gap between those two numbers is the whole problem. When a recycling load arrives 15 to 25 percent contaminated but buyers demand near-zero contamination, processors must either invest heavily to clean it or send it to the landfill. A study of materials recovery facilities found that contaminated loads of sorted cardboard frequently failed to meet the standards paper mills require, meaning material that traveled through the entire collection and sorting process still ended up buried.
Copia Resources Analysis: Why a “Full” Recycling Bin Can Still Be a Trash BillCombine two realities: contamination commonly runs 15 to 25 percent at the facility level, and a single problem item, plastic film, a greasy box, a half-full container, can downgrade an entire load. That means a recycling bin that looks correctly filled can still be billed and disposed of as trash if it crosses a contamination threshold. The financial exposure is not theoretical, it is the difference between a recycling rebate and a contamination surcharge on the same container. This is precisely why source-level sorting support and contamination monitoring protect a property’s budget. Calculation and interpretation original to Copia Resources, based on industry contamination data.
Single-stream recycling, where everything goes in one bin, drove this problem. It made participation easier but mixed paper, glass, plastic, and metal together, so materials get wet, greasy, or broken before they reach the facility. The convenience came at the cost of quality, and quality is what buyers pay for.
Source: Waste Dive industry reporting | University at Buffalo research
Ask About Contamination Monitoring and the CR Guarantee
5How China’s National Sword Changed Everything
To understand why recycling got harder and more expensive after 2018, you have to look at one policy decision made thousands of miles away.
For years, the U.S. exported much of its mixed recycling to China for processing. In 2016 alone, the U.S. shipped about 16 million tons of plastic, paper, and metals there. In 2018, China’s National Sword policy banned many materials and imposed a 0.5 percent contamination limit that domestic mixed recyclables could not meet. The export market effectively closed overnight.
The consequences rippled through every recycling program. Processing costs jumped, in some cities by $50 per ton almost immediately, as facilities slowed sorting lines and added workers to improve quality. The amount of plastic sent to U.S. landfills rose sharply. National Sword did not create the contamination problem, but it removed the escape valve that had been hiding it, and turned contamination control into the central economic issue in recycling.
Source: ScienceDirect, A Recycling Reckoning | University at Buffalo research summary
Reduce Contamination With Structured Waste Management
6Where U.S. Recycling Goes Next
The outlook is not all decline. The same EPA assessment that documented the gaps also mapped a path to close them, and the numbers show real upside.
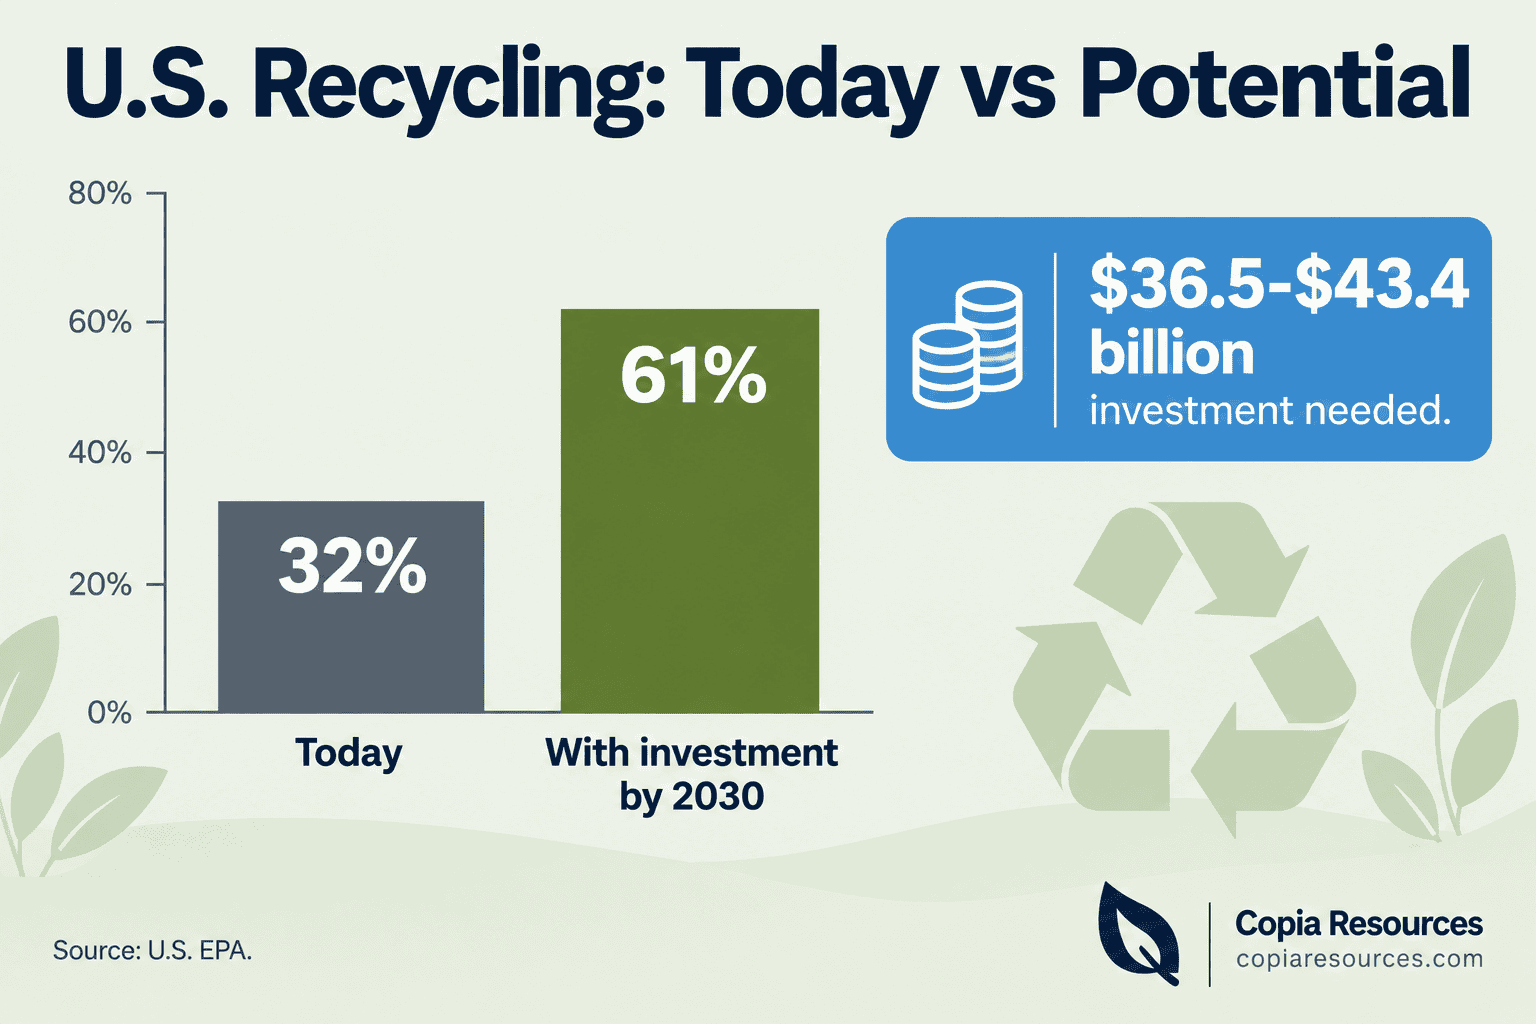
The EPA estimates that $36.5 to $43.4 billion in investment across collection, sorting, processing, and end markets by 2030 could nearly double recovery, a 91 percent increase over the 94 million tons recycled and composted in 2018. That would lift the national rate from 32 percent to as high as 61 percent and surpass the federal goal of a 50 percent recycling rate by 2030.
Infrastructure is the national lever. At the property level, the lever is contamination. Clean, well-sorted material is worth more and is far less likely to be rejected or surcharged, which is why education, signage, and source-level support do more for a single property’s recycling outcomes than any policy change. The properties that win on recycling economics are the ones that keep their streams clean.
Source: U.S. EPA Recycling Infrastructure Assessment
See Property Management Industry Statistics for 2026
Recycling Statistics 2026: Summary Table
| Statistic | Figure | Source | Year |
|---|---|---|---|
| U.S. recycling and composting rate | 32.1% | U.S. EPA | 2018 |
| U.S. recycling rate (prior peak) | 34.7% | U.S. EPA | 2015 |
| Packaging and organics rate | 38.9% | U.S. EPA | 2019 |
| Material recycled and composted | ~94 million tons | U.S. EPA | 2018 |
| Corrugated cardboard recycled | 96.5% | U.S. EPA | 2018 |
| Paper and paperboard recycled | 68.2% | U.S. EPA | 2018 |
| Newspaper recycled | 64.8% | U.S. EPA | 2018 |
| Aluminum cans recycled | 50.4% | U.S. EPA | 2018 |
| Glass containers recycled | 31.3% | U.S. EPA | 2018 |
| PET plastic bottles recycled | 29.1% | U.S. EPA | 2018 |
| Plastics (all) recycled | 8.7% | U.S. EPA | 2018 |
| Plastic generated | 35.7 million tons | U.S. EPA | 2018 |
| Paper’s share of all recycling | ~67% | U.S. EPA | 2018 |
| MRF contamination range | 15-25% | Waste Dive | 2018 |
| National Sword contamination limit | 0.5% | SWANA / academic | 2018 |
| China plastic imports (pre-ban) | 5.7 million metric tons | ScienceDirect | 2017 |
| U.S. recyclables exported to China | 16 million tons | Columbia Climate School | 2016 |
| Potential U.S. recycling rate | Up to 61% | U.S. EPA | 2030 proj. |
| Investment needed by 2030 | $36.5-43.4 billion | U.S. EPA | 2030 proj. |
| Additional recovery potential | 82-89 million tons | U.S. EPA | 2030 proj. |
Frequently Asked Questions
What is the recycling rate in the United States?
Which materials have the highest recycling rates?
What percentage of plastic is actually recycled?
How does contamination affect recycling?
Why did U.S. recycling get harder after 2018?
Methodology and Sources
About This Data
Recycling rate and material-specific figures come from the U.S. Environmental Protection Agency’s Advancing Sustainable Materials Management report, whose most recent complete dataset covers calendar year 2018, supplemented by the EPA’s Assessment of the U.S. Recycling System using 2019 data. Contamination figures reflect materials recovery facility operator data reported through industry sources and peer-reviewed research. China National Sword figures come from academic research. Where 2018 is the latest authoritative national figure, it is presented as the current baseline and dated accordingly.
Primary sources:
- U.S. Environmental Protection Agency, Advancing Sustainable Materials Management: Facts and Figures
- U.S. Environmental Protection Agency, Assessment of the U.S. Recycling System (2019 data)
- Solid Waste Association of North America (SWANA) and peer-reviewed research on National Sword
- University at Buffalo, Impact of China’s National Sword Policy study
- Industry reporting on MRF contamination (Waste Dive, Waste360)
Media and press usage: Journalists and publishers are welcome to cite these statistics with attribution to the original primary sources named above and a link to this page. For questions about contamination control or California recycling compliance, contact Copia Resources.
Request a Quote for Valet Trash and Recycling Service