

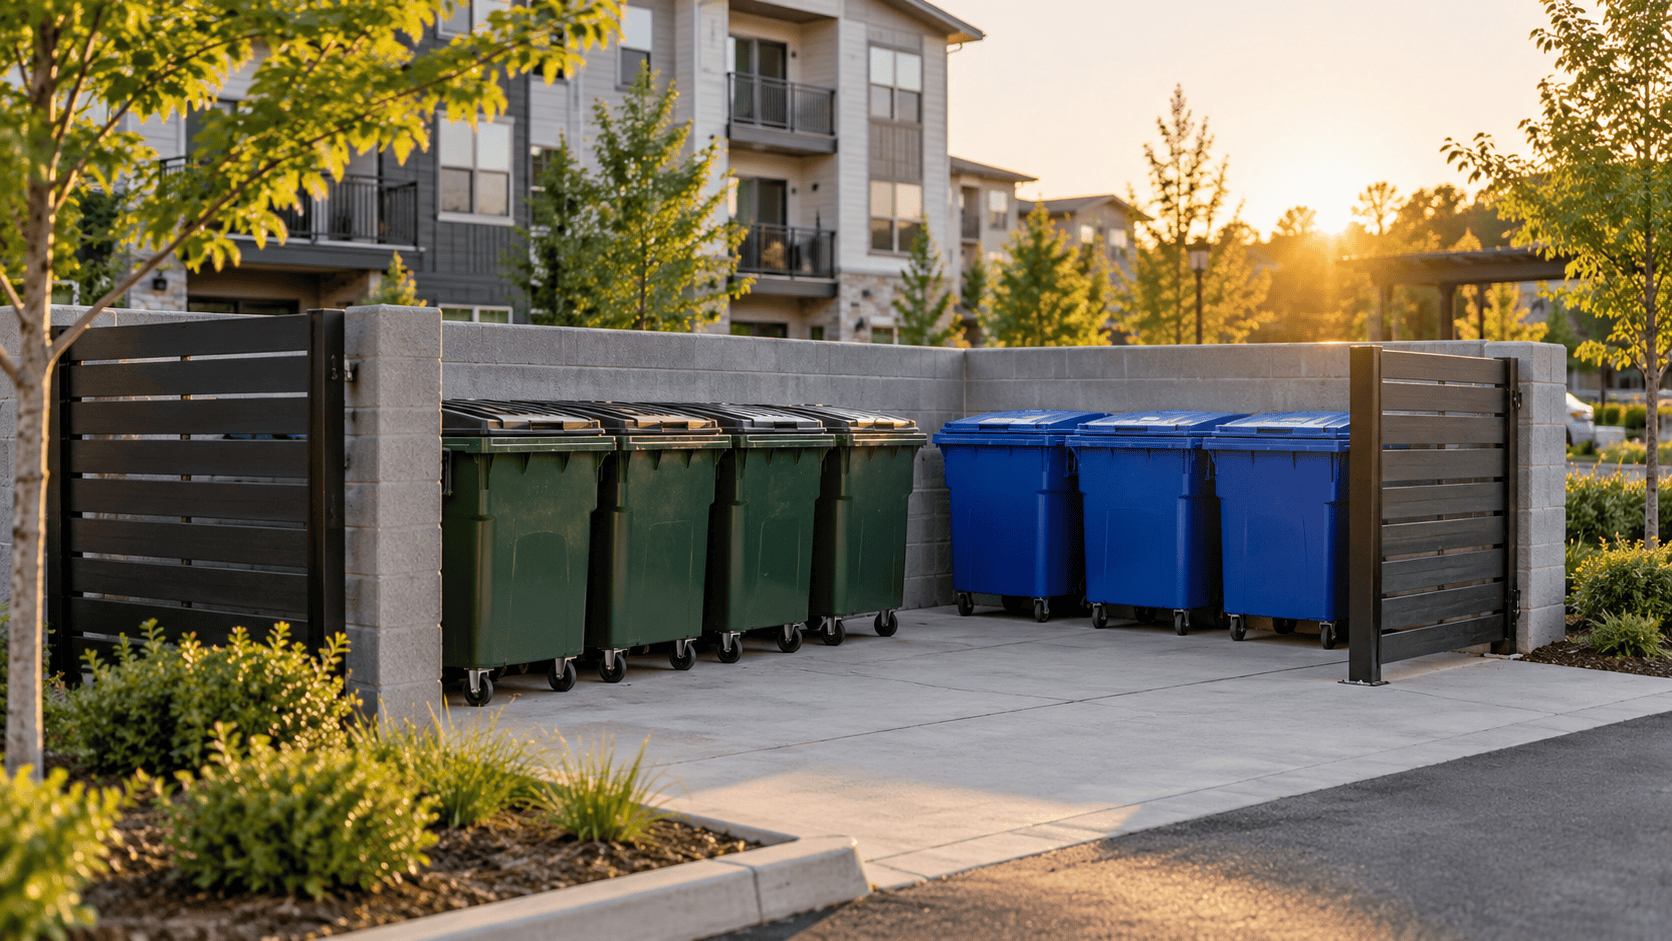
The United States generated 292.4 million tons of municipal solid waste in 2018, about 4.9 pounds per person every day, and roughly half of it went straight to a landfill. For the property managers and owners who pay the bills, those national numbers translate into real overage charges, contamination fees, and curb appeal problems on the ground.
Key Takeaways
- The U.S. generated 292.4 million tons of municipal solid waste in 2018, the latest year in the EPA’s national accounting, equal to 4.9 pounds per person per day.
- About 50 percent of U.S. municipal solid waste was landfilled, while only 32.1 percent was recycled or composted.
- Global waste is projected to grow 70 percent, from 2.01 billion tonnes in 2016 to 3.40 billion tonnes by 2050, according to the World Bank.
- Food is the largest single component of landfilled waste in the U.S. at about 24 percent, and the largest component of California’s landfill stream.
- Recycling and reuse supported 681,000 U.S. jobs, $37.8 billion in wages, and $5.5 billion in tax revenue in the EPA’s 2020 economic report.
- California’s SB 1383 requires a 75 percent reduction in organic waste disposal by 2025, with roughly 27 million tons of organics to divert statewide.
- Containers and packaging make up the largest share of waste generated at 28.1 percent, a direct driver of bin overflow at multi-family and commercial properties.
What’s in This Guide
1How Much Waste the U.S. Generates
Municipal solid waste, the everyday trash from homes, apartments, offices, stores, and institutions, is measured nationally by the U.S. Environmental Protection Agency. The most recent full accounting comes from the EPA’s Advancing Sustainable Materials Management report, which covers calendar year 2018.
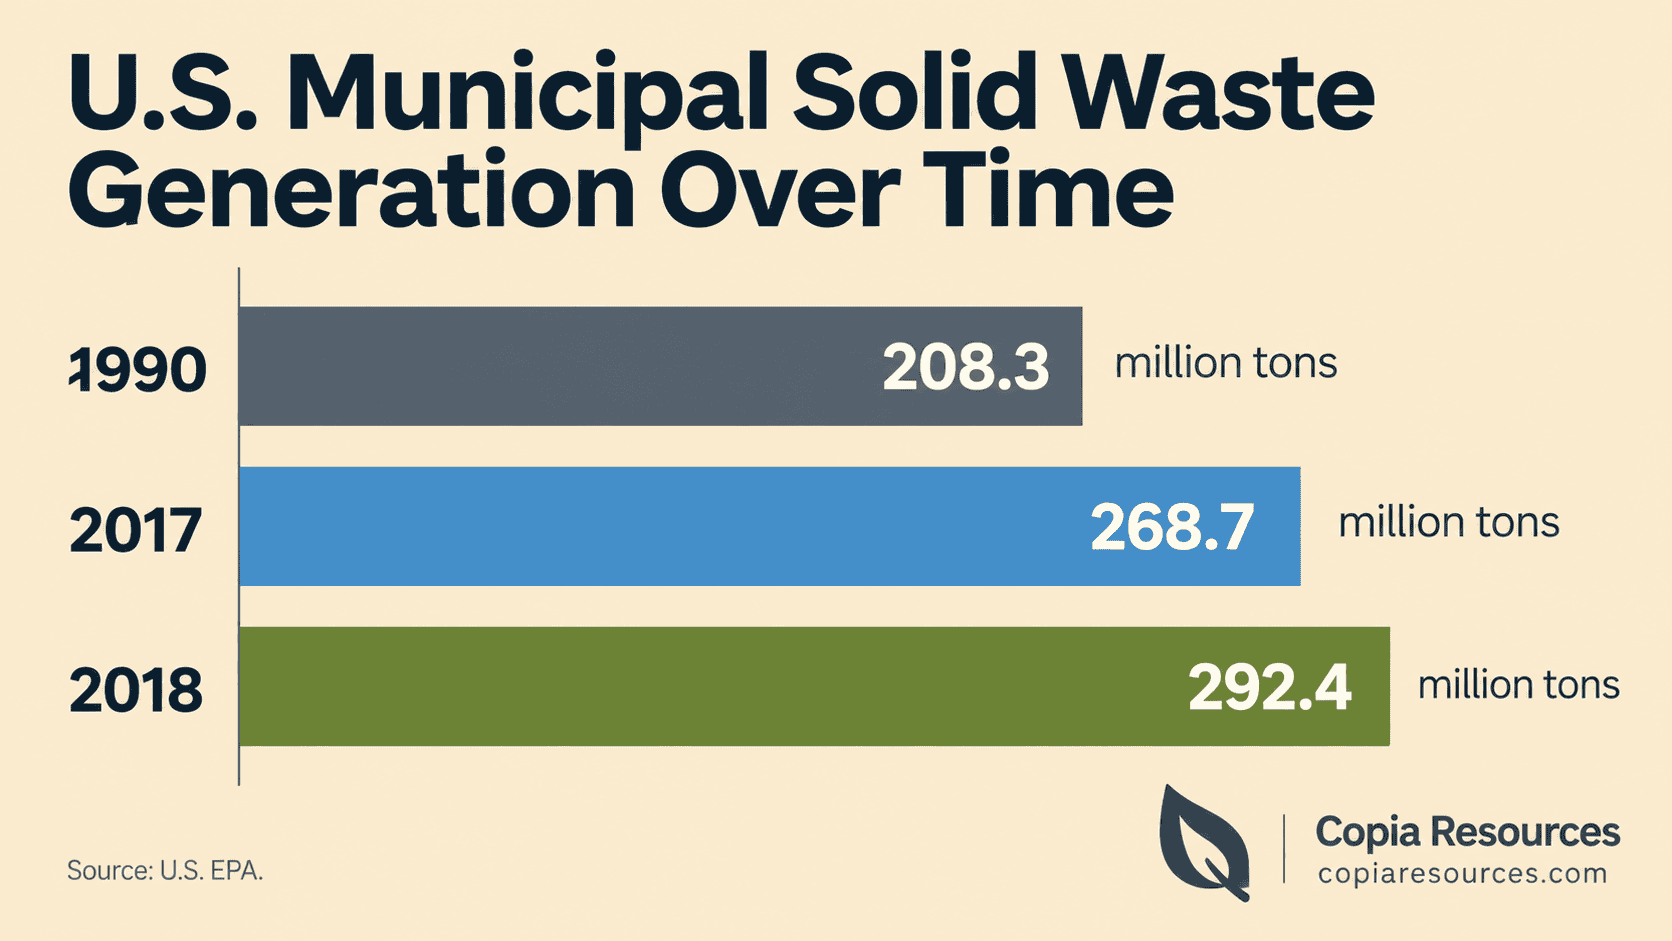
That figure represents a long climb. The U.S. generated 208.3 million tons in 1990 and 268.7 million tons in 2017, so the waste stream has grown substantially even as the population has grown more slowly. Part of the jump from 2017 to 2018 came from the EPA improving how it measures wasted food, but the upward trend is real and decades long.
Per capita generation has risen from 3.7 pounds per person per day in 1980 to 4.9 pounds in 2018, a 34 percent increase, according to the University of Michigan’s Center for Sustainable Systems analysis of EPA data. For comparison, the same analysis put per capita rates at 2.8 pounds in the United Kingdom and 2.6 pounds in Sweden, meaning the average American throws away nearly twice as much as the average Swede.
U.S. Municipal Solid Waste Generation Over Time (million tons)
Source: U.S. EPA, Advancing Sustainable Materials Management (2018 data)
For a property manager, the practical takeaway is simple: the volume of material flowing through your bins, chutes, and enclosures is not shrinking. Service levels set five years ago may already be undersized, which is one of the quiet causes of recurring overflow and overage charges.
Source: U.S. EPA National Overview | University of Michigan Center for Sustainable Systems
See How Structured Trash Management Cuts Overflow
2Where Waste Actually Goes
Generating waste is only half the story. How that material is managed, landfilled, recycled, composted, or burned for energy, determines the environmental impact and, increasingly, the regulatory exposure for the businesses that produce it.
Breaking the diversion number down further, recycling accounted for about 69 million tons and composting for roughly 25 million tons in 2018, together almost 94 million tons kept out of landfills and incinerators. That is about 2.8 times the amount diverted in 1990, real progress, but it still leaves half the waste stream buried.
How U.S. Municipal Solid Waste Was Managed (2018)
Source: U.S. EPA. Remaining share managed through other food pathways.
Myth: “If it goes in the recycling bin, it gets recycled.”Not necessarily. Contamination, mixing the wrong materials into a recycling stream, routinely sends entire loads to the landfill and triggers contamination surcharges from haulers. The EPA notes that consumer confusion about what is and is not recyclable is one of the biggest weaknesses in the U.S. system. A bin that looks full of recyclables can still be billed and disposed of as trash if it is contaminated.
Source: U.S. EPA National Overview | U.S. EPA Recycling System Overview
Explore On-Site Waste and Diversion Services
3What’s in the Waste Stream
Knowing what makes up the waste stream is the first step to managing it. The composition data explains why bins overflow, why odor builds up, and where diversion opportunities actually exist.
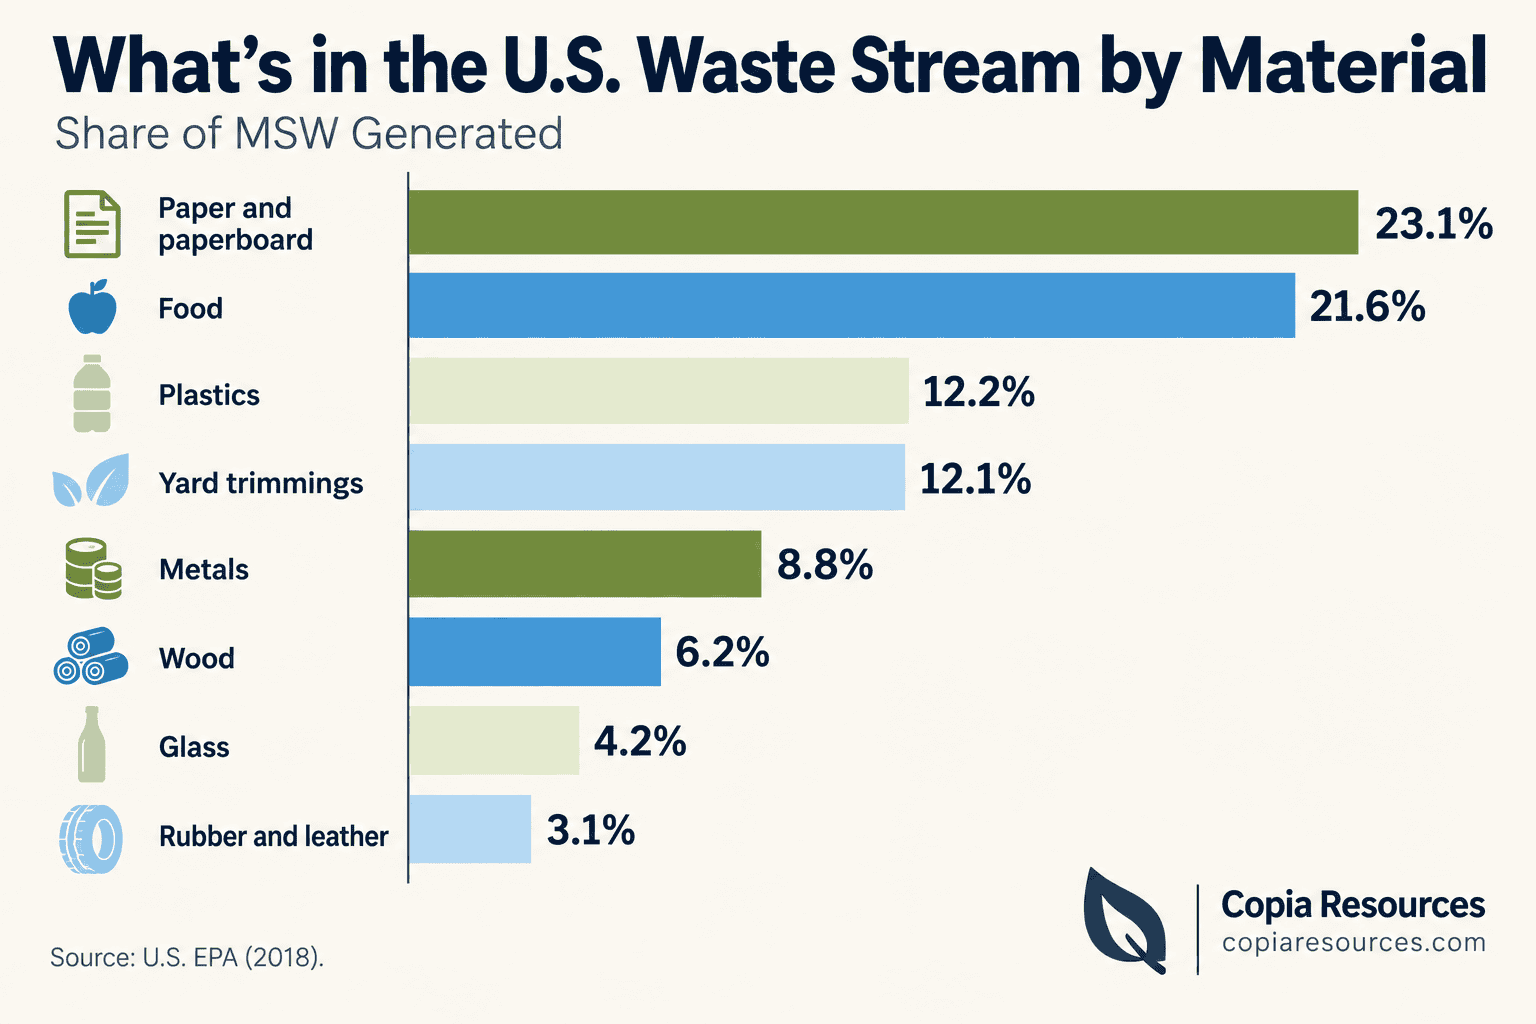
By material, organics dominate. Paper and paperboard accounted for 23.1 percent of generation in 2018, with yard trimmings and food adding another 33.7 percent combined. Plastics made up 12.2 percent, metals 8.8 percent, wood 6.2 percent, and glass 4.2 percent. For multi-family and commercial properties, the packaging and food fractions are the ones that drive daily operational headaches, overflowing bins from cardboard and containers, and odor and pest issues from food waste.
| Material | Share of MSW Generated (2018) |
|---|---|
| Paper and paperboard | 23.1% |
| Food | 21.6% |
| Plastics | 12.2% |
| Yard trimmings | 12.1% |
| Metals | 8.8% |
| Wood | 6.2% |
| Glass | 4.2% |
| Rubber and leather | 3.1% |
Containers and packaging are also the most recycled product category, with about 40 percent recovered, because materials like steel cans, cardboard, and aluminum have established end markets. The challenge is capturing them cleanly at the source, before they end up mixed into the trash or contaminated by food residue.
Copia Resources Analysis: The Overflow Math at a Multi-Family PropertyCombining two EPA figures, 4.9 pounds of waste per person per day and containers/packaging at 28.1 percent of generation, a 200-resident apartment community produces roughly 980 pounds of waste daily, of which about 275 pounds is containers and packaging. That packaging is bulky and light, which means it fills bin volume far faster than its weight suggests. This is why enclosures look overflowing well before a hauler would consider the bins “full” by weight, and why right-sized service and bin management matter more than raw pickup frequency. Calculation and interpretation original to Copia Resources, based on U.S. EPA data.
Source: U.S. EPA Facts and Figures Guide
Waste Solutions Built for Multi-Family Properties
4Global Waste Statistics
The U.S. is not alone in producing more waste each year. The World Bank’s What a Waste 2.0 report, the most comprehensive global accounting available, drew on data from 217 countries and economies and more than 360 cities.
The distribution is lopsided. High-income countries hold just 16 percent of the world’s population but generate about 34 percent of its waste, roughly 683 million tonnes a year. Globally, only an estimated 13.5 percent of waste is recycled and 5.5 percent is composted, which means the overwhelming majority is still landfilled, dumped, or burned.
Projected Global Waste Generation (billion tonnes)
Source: World Bank, What a Waste 2.0. Business-as-usual scenario.
The cost burden is just as striking. The World Bank found that waste management is often the single highest budget line item for local governments in low-income countries, near 20 percent of municipal budgets on average. Even in high-income countries it accounts for roughly 4 percent. Waste is expensive everywhere, which is exactly why bill accuracy and waste diversion carry real financial weight for the organizations footing the bill.
Source: World Bank What a Waste 2.0 data platform | World Bank report summary
See the Latest Recycling Statistics for 2026
5The Economics of Waste and Recycling
Waste management is not just an environmental category, it is a sizable economic engine. The EPA’s Recycling Economic Information report quantifies what recycling and reuse contribute to the U.S. economy.
The EPA’s 2020 report, based on 2012 economic data, equates this to about 1.17 jobs for every 1,000 tons of material recycled. Construction and demolition material and ferrous metals are the largest contributors to jobs, wages, and tax revenue. The economic case reinforces the operational one: material that gets diverted and recovered has value, while material that gets contaminated and landfilled becomes pure cost.
| Economic Impact of U.S. Recycling | Figure | Source Year |
|---|---|---|
| Jobs supported | 681,000 | 2020 REI (2012 data) |
| Annual wages | $37.8 billion | 2020 REI (2012 data) |
| Annual tax revenue | $5.5 billion | 2020 REI (2012 data) |
| Jobs per 1,000 tons recycled | 1.17 | 2020 REI |
Why bill audits matter:Because waste hauling is priced on container size, pickup frequency, and contamination, the gap between what a property is billed and what it actually needs can be significant. Quarterly invoice review routinely surfaces overcharges, mismatched service levels, and avoidable contamination fees, turning a fixed cost back into a managed one.
Source: U.S. EPA Recycling Economic Information Report | USAFacts analysis of EPA data
Request a Quarterly Hauler Bill Audit
6California and the Cost of Compliance
For properties on the West Coast, state mandates raise the stakes well beyond the national averages. California has the strictest waste diversion framework in the country, and the compliance clock has already started.
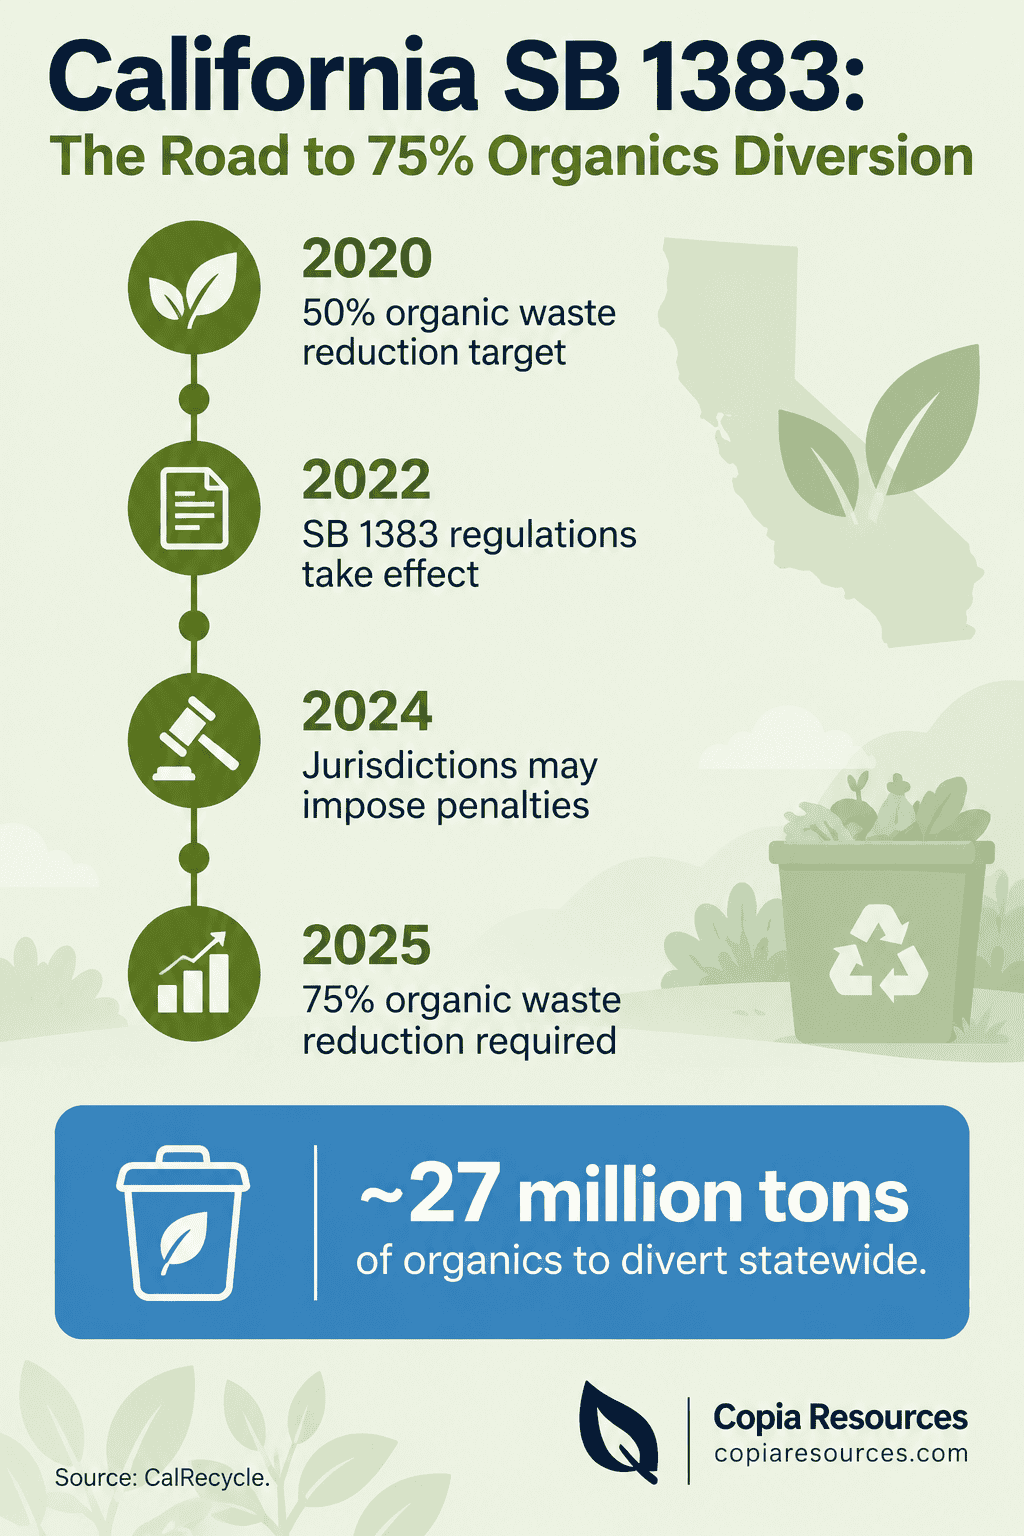
Three laws shape the landscape. AB 341 set a statewide 75 percent recycling goal and first required commercial recycling. AB 1826 phased in mandatory commercial organics recycling. SB 1383, the most consequential for property owners, requires a 75 percent reduction in organic waste disposal from 2014 levels by 2025 and a 20 percent recovery of edible food. Organic waste in landfills emits roughly 20 percent of California’s methane, a pollutant far more potent than carbon dioxide over the short term, which is why the state is pushing diversion so hard.
Compliance is now enforceable, with penalties.SB 1383 regulations took effect January 1, 2022, and since January 1, 2024 local jurisdictions have been able to impose penalties for noncompliance. The regulations also require annual route audits and contamination monitoring, lid-flips and cart inspections, meaning multi-family and commercial properties can be cited for improperly sorted bins. Setting up compliant organics collection and keeping contamination down is no longer optional in California.
For multi-family communities, this is where the operational and the regulatory meet. Food waste that used to be a smell-and-pest nuisance is now a compliance obligation, and contamination that used to be a billing annoyance can now carry fines. Programs that make sorting easy for residents and keep contamination low protect both the property’s budget and its compliance standing.
Source: CalRecycle SB 1383 program | CalRecycle State of Disposal and Recycling report
See Property Management Industry Statistics for 2026
Waste Management Statistics 2026: Summary Table
| Statistic | Figure | Source | Year |
|---|---|---|---|
| U.S. municipal solid waste generated | 292.4 million tons | U.S. EPA | 2018 |
| U.S. waste per person per day | 4.9 lbs | U.S. EPA | 2018 |
| U.S. waste landfilled | 50.0% (146.1M tons) | U.S. EPA | 2018 |
| U.S. recycling and composting rate | 32.1% | U.S. EPA | 2018 |
| U.S. waste combusted for energy | 11.8% | U.S. EPA | 2018 |
| Material recycled + composted | ~94 million tons | U.S. EPA | 2018 |
| Containers and packaging share | 28.1% of generation | U.S. EPA | 2018 |
| Food share of landfilled waste | ~24% | U.S. EPA | 2018 |
| U.S. food waste generated | 63+ million tons | U.S. EPA | 2018 |
| Global waste generated | 2.01 billion tonnes | World Bank | 2016 |
| Global waste projected by 2050 | 3.40 billion tonnes | World Bank | 2050 proj. |
| Global waste mismanaged | At least 33% | World Bank | 2018 |
| Global recycling rate | ~13.5% | World Bank | 2018 |
| U.S. recycling jobs supported | 681,000 | U.S. EPA REI | 2020 |
| U.S. recycling annual wages | $37.8 billion | U.S. EPA REI | 2020 |
| U.S. recycling tax revenue | $5.5 billion | U.S. EPA REI | 2020 |
| California disposal per resident per day | 6.7 lbs | CalRecycle | 2019 |
| SB 1383 organics reduction target | 75% by 2025 | CalRecycle | 2025 target |
| California organics to divert by 2025 | ~27 million tons | CalRecycle | 2025 target |
| Organic waste share of CA methane | ~20% | CalRecycle | 2026 |
Frequently Asked Questions
How much waste does the United States generate each year?
What is the recycling rate in the United States?
How much does food waste contribute to landfills?
How is global waste generation expected to change by 2050?
How many people does the recycling industry employ in the United States?
Methodology and Sources
About This Data
Every statistic in this article traces to a primary source: U.S. government agencies, the World Bank, and state regulators. National U.S. waste figures come from the EPA’s Advancing Sustainable Materials Management report, whose most recent full dataset covers calendar year 2018. Where 2018 is the latest available authoritative figure, it is presented as the current national baseline and dated accordingly. Global figures come from the World Bank’s What a Waste 2.0 report. California figures come from CalRecycle.
Primary sources:
- U.S. Environmental Protection Agency, Advancing Sustainable Materials Management: Facts and Figures
- U.S. Environmental Protection Agency, 2020 Recycling Economic Information (REI) Report
- World Bank, What a Waste 2.0: A Global Snapshot of Solid Waste Management to 2050
- CalRecycle, State of Disposal and Recycling in California, and SB 1383 program documentation
- University of Michigan Center for Sustainable Systems, Municipal Solid Waste Factsheet
Media and press usage: Journalists and content publishers are welcome to cite these statistics with attribution to the original primary sources named above and a link to this page. For questions about the data or California compliance, contact Copia Resources.
Request a Quote for Valet Trash and Waste Services