

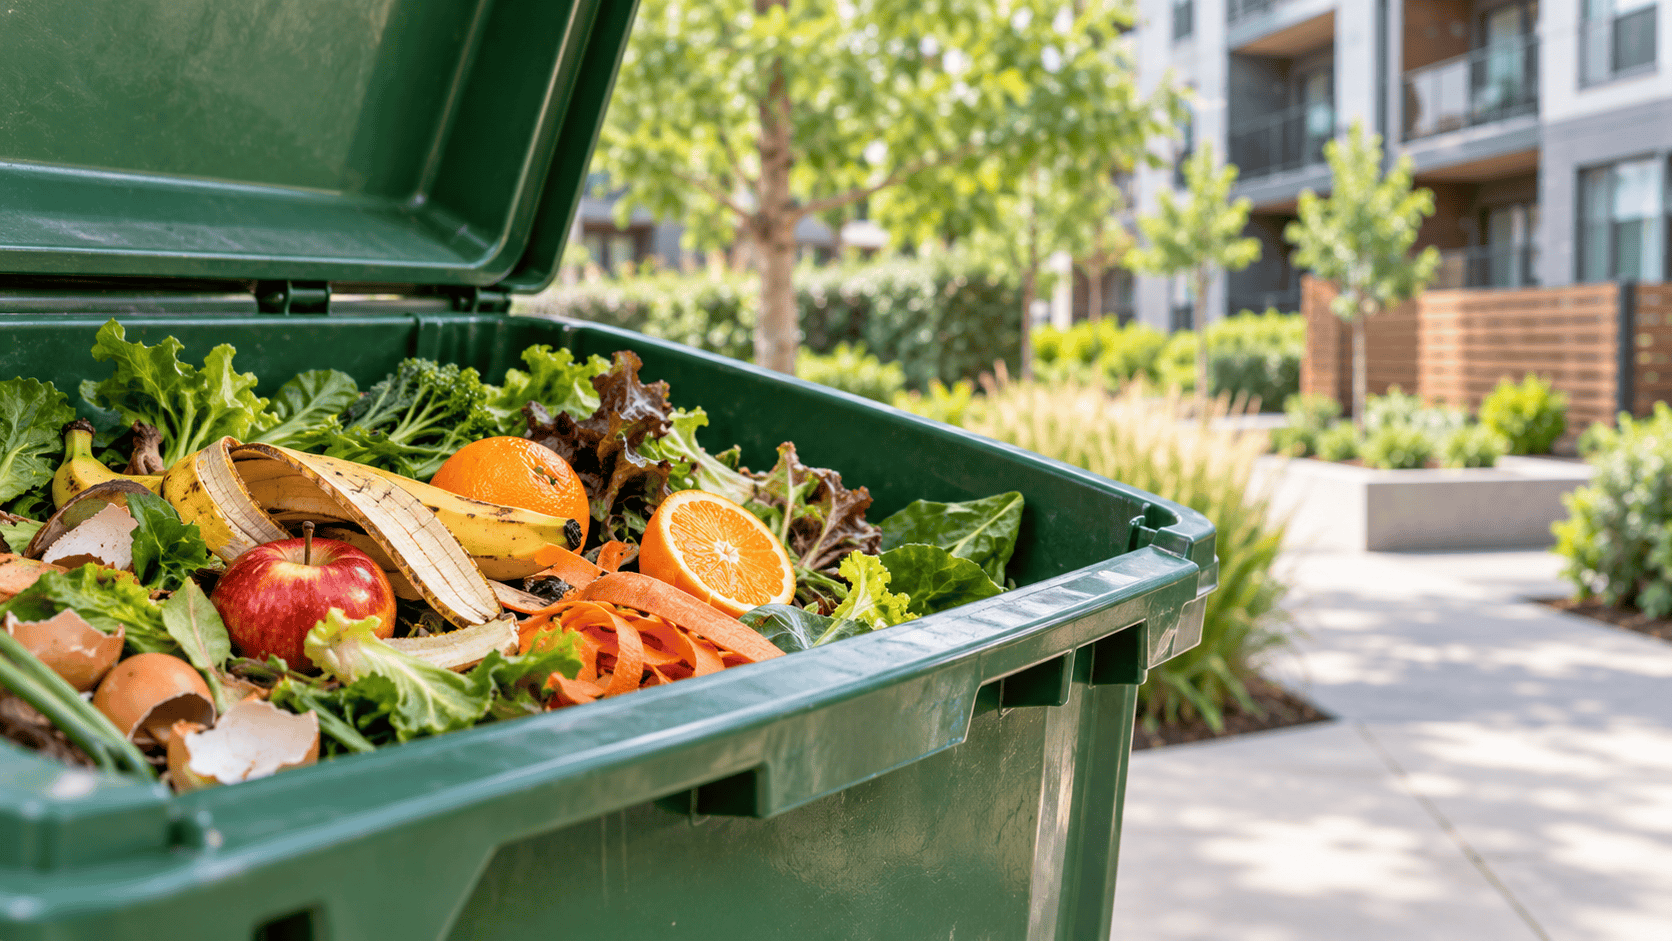
The United States threw away roughly 70 million tons of surplus food in 2024, worth about $380 billion, and nearly all of it could have been prevented, eaten, or diverted. For property owners and managers, food waste is not an abstract environmental issue: it is the source of the odor, pests, and overflow complaints that fill maintenance tickets, and in California it is now a compliance obligation.
Key Takeaways
- The U.S. generated about 70 million tons of surplus food in 2024, roughly 29 percent of the total food supply.
- That surplus food was worth about $380 billion, with roughly $325 billion of it wasted rather than recovered.
- Food is the single largest category of material in U.S. landfills at about 24 percent.
- Food waste generates an estimated 58 percent of the fugitive methane emissions from municipal solid waste landfills.
- Households generate roughly a third of U.S. surplus food, the largest single source.
- 2024 brought the first year-over-year decline in U.S. food waste since the pandemic, down 2.2 percent.
- California requires a 75 percent reduction in organic waste disposal by 2025 under SB 1383, making food diversion mandatory.
What’s in This Guide
1The Scale of U.S. Food Waste
The most authoritative annual accounting of U.S. food waste comes from ReFED, a national nonprofit that models the entire food supply chain. Its 2026 report, using 2024 data, is the most current available.
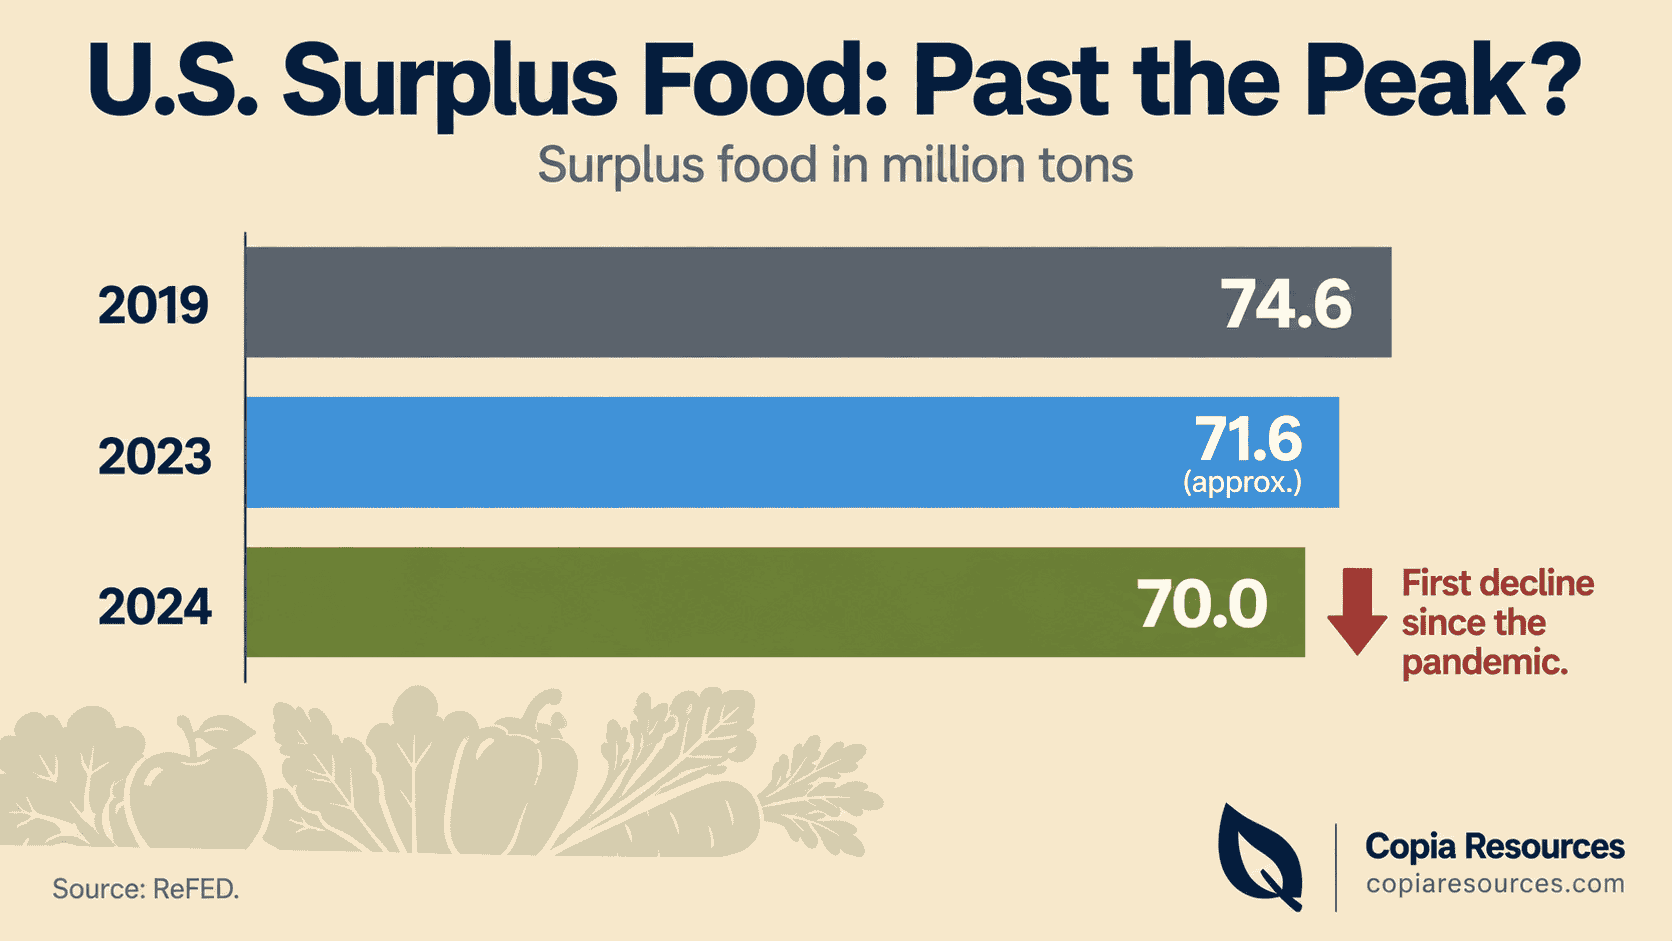
There is good news inside these numbers. Surplus food fell 2.2 percent from 2023 to 2024, the first meaningful year-over-year decline since a pandemic-era dip, led by a nearly 950,000-ton reduction in residential food waste. Surplus had peaked at 74.6 million tons in 2019 before dropping in 2020 and then climbing again through 2023. ReFED suggests the country may have moved past “peak food waste,” though with 85 percent of surplus still wasted, the room for improvement remains enormous.
Surplus food vs food waste:ReFED distinguishes “surplus food” (everything unsold or uneaten, including what gets donated or fed to animals) from “food waste” (the portion that actually goes to landfill, incineration, sewer, or is left unharvested). The goal is not just to keep food out of landfills, but to move it to its highest use: feeding people first.
Source: ReFED 2026 U.S. Food Waste Report | ReFED Food Waste Overview
See Copia’s Waste Diversion Services
2What Food Waste Costs
Food waste is increasingly understood as a financial problem, not just an environmental one. The dollar figures are large enough that businesses are elevating the issue to the boardroom.
Within the food industry itself, surplus food across all sectors was worth about $122 billion in 2024, excluding plate waste. The cost lands on consumers, businesses, and ultimately the waste systems that have to handle the discarded material. For a property, the cost shows up indirectly but reliably: more frequent pickups, contaminated recycling, odor mitigation, and pest control all trace back, in part, to food in the waste stream.
Copia Resources Analysis: The Hidden Property Cost of Food in the TrashTwo facts combine into a property-level problem. First, food is about 24 percent of landfilled municipal solid waste (EPA). Second, food decays fast, which is what drives odor, pests, and the resident complaints that consume maintenance hours. So roughly a quarter of what fills a property’s bins is also the single biggest driver of its sanitation headaches. Diverting that fraction through organics collection does double duty: it cuts the volume going to landfill and removes the fastest-rotting material from enclosures and trash rooms. Calculation and interpretation original to Copia Resources, based on EPA and ReFED data.
Source: ReFED 2026 Food Waste Report (PDF)
Request a Waste Diversion Consultation
3Where Food Waste Comes From
Food waste happens at every stage of the supply chain, but not evenly. Knowing which sectors generate the most surplus helps target where diversion makes the biggest difference.
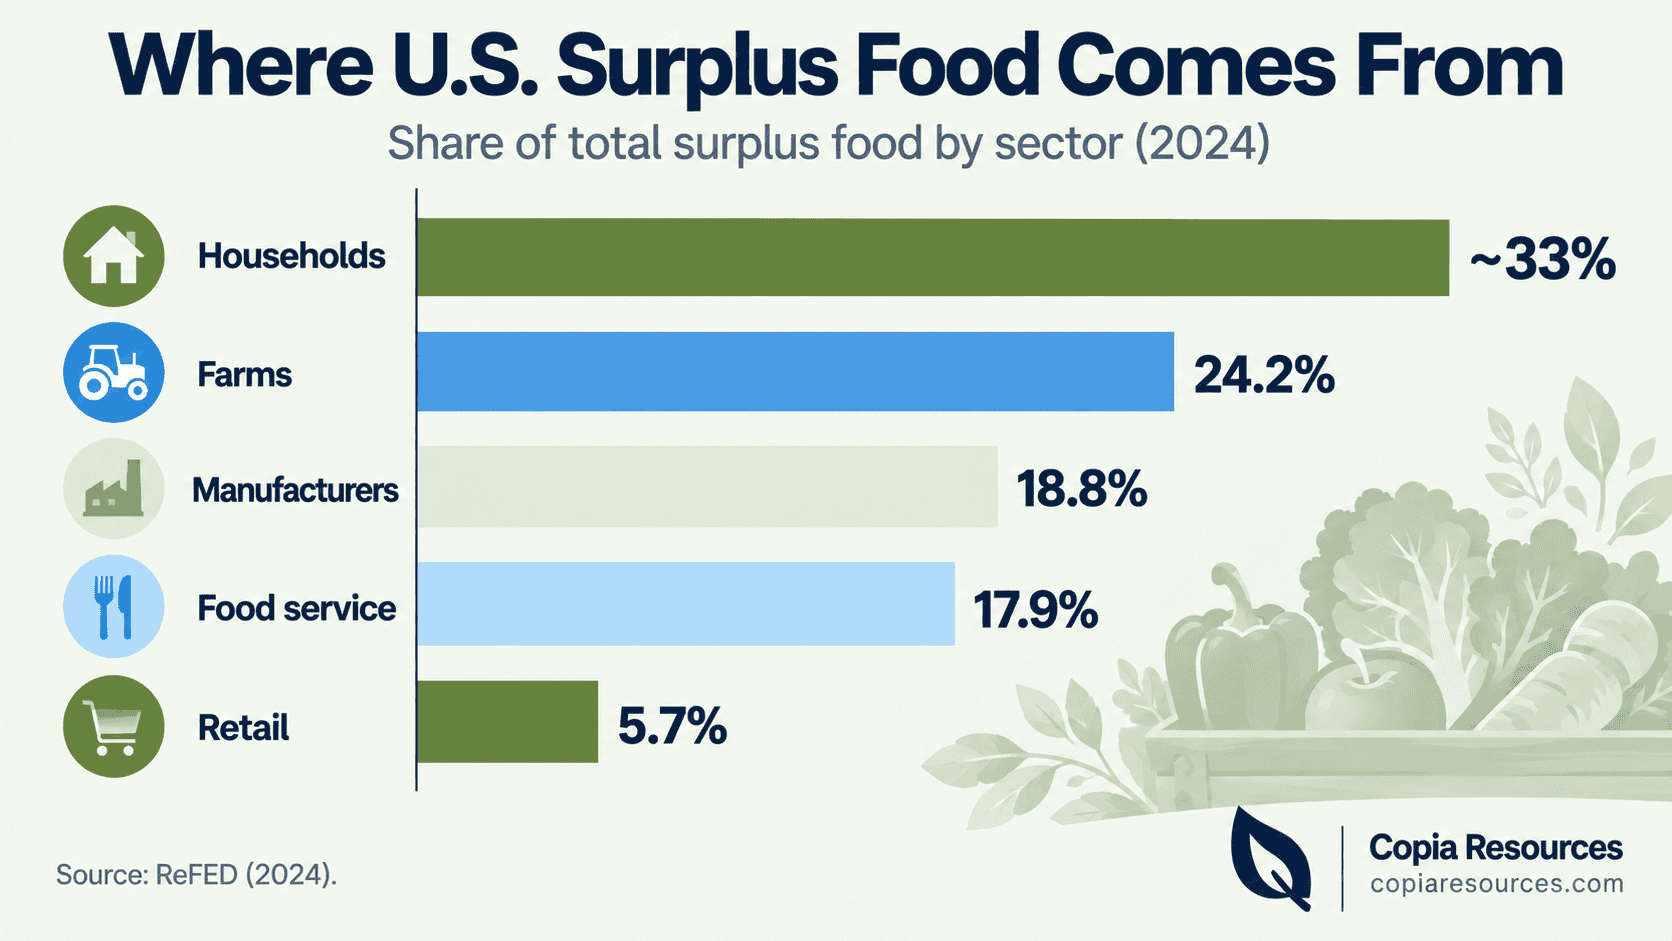
The full breakdown shows households at roughly a third, with farms generating 24.2 percent, manufacturers 18.8 percent, food service 17.9 percent, and retail 5.7 percent. For multi-family and commercial property managers, two of these sectors matter most: residential waste, which dominates apartment communities, and food service, which drives waste at retail centers, restaurants, and venues.
U.S. Surplus Food by Sector (2024)
Source: ReFED, 2024 data. Household share is approximately one-third.
By food type, perishables dominate. More than 80 percent of surplus food comes from perishable categories like fruits, vegetables, meats, dairy, and bakery items, and fruits and vegetables alone make up more than a third of total food waste. These are exactly the materials that create odor and attract pests when they sit in a trash room or enclosure, which is why food diversion and property cleanliness are so tightly linked.
Source: Waste Dive analysis of ReFED data | ReFED Food Waste Overview
Food Waste Solutions for Multi-Family Properties
4Food Waste, Landfills, and Methane
The environmental case against landfilling food is stronger than most people realize, and it is the reason states like California are forcing food out of the trash.
The EPA’s research on landfilled food is striking. Food is not only the biggest category of buried waste, it is the biggest methane producer among landfilled materials because it decays so quickly. Municipal solid waste landfills are the third-largest source of human-caused methane emissions in the United States, and food waste drives the majority of those emissions. Methane is a short-lived but powerful greenhouse gas, estimated to be far more potent than carbon dioxide over a 20-year window.
Myth: “Food breaks down naturally in a landfill, so it’s harmless.”The opposite is true. In a landfill, food decomposes without oxygen (anaerobically), which produces methane rather than the harmless carbon dioxide and compost you get from aerobic composting. The EPA’s updated Wasted Food Scale even ranks sending food down the drain as worse than some other pathways for methane. The most environmentally beneficial option is preventing the waste in the first place, followed by diverting it to composting or anaerobic digestion, not burying it.
This is the mechanism behind California’s mandate. By pulling food out of landfills and into composting or anaerobic digestion, the state targets the single largest controllable source of landfill methane. For properties, the same diversion that satisfies regulators also keeps the fastest-rotting, smelliest material out of enclosures.
Source: U.S. EPA, Quantifying Methane from Landfilled Food Waste | U.S. EPA Food Waste Research
See the Latest Recycling Statistics for 2026
5Global Food Waste Statistics
The U.S. is part of a worldwide pattern. The scale of global food waste puts the national numbers in context.
The United Nations Food and Agriculture Organization has long estimated that roughly one-third of food produced worldwide, on the order of 1.3 billion tonnes a year, is never eaten. The UN Environment Programme attributes 8 to 10 percent of global greenhouse gas emissions to food loss and waste, a footprint so large that if food waste were a country, it would rank among the top greenhouse gas emitters in the world. The resources embedded in that wasted food, the water, land, energy, and labor used to grow and move it, are lost along with the food itself.
Source: U.S. EPA Food Waste Research | UNEP Food Loss and Waste facts
See the Full Waste Management Statistics for 2026
6California’s Food Waste Mandate
For West Coast properties, food waste is not just an efficiency question, it is the law. California has the most aggressive organics diversion framework in the country, and food is at its center.
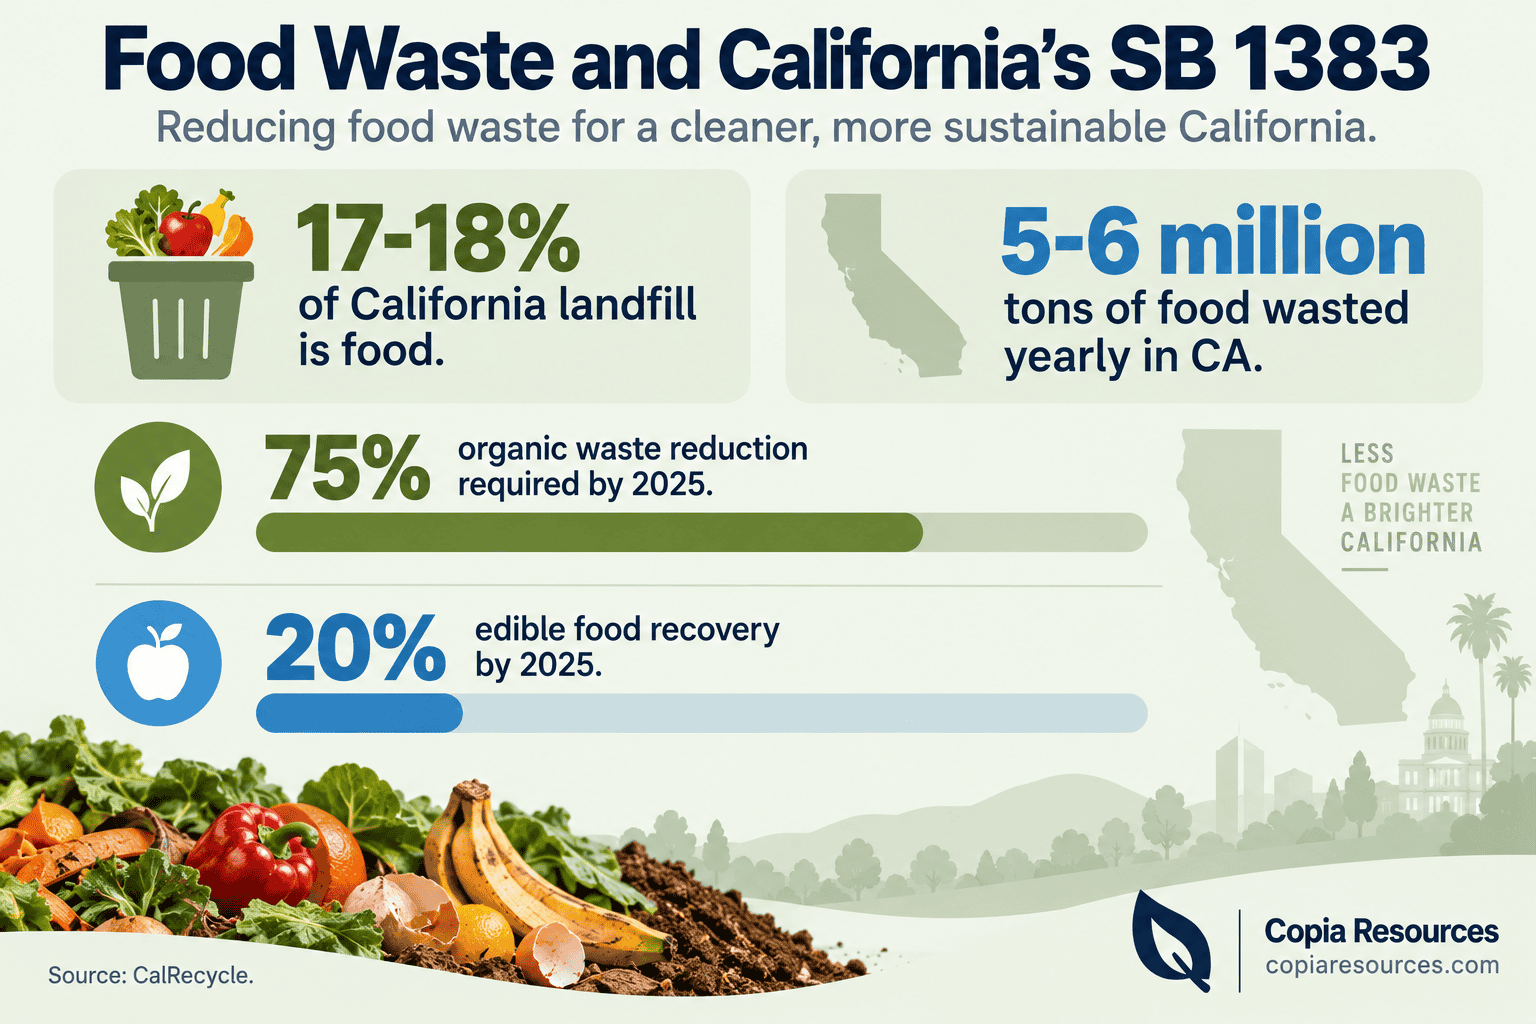
California throws away an estimated 5 to 6 million tons of food every year, and organic waste in landfills emits roughly 20 percent of the state’s methane. SB 1383 responds with two requirements that hit properties directly: a 75 percent cut in organic waste disposal from 2014 levels by 2025, and a mandate that large food generators donate at least 20 percent of the edible food they would otherwise discard. AB 1826 separately requires commercial organics recycling, and AB 341 set the broader 75 percent recycling goal.
For multi-family and commercial properties, compliance is active now.SB 1383 regulations took effect in 2022, and since January 1, 2024 jurisdictions have been able to impose penalties for noncompliance. The rules also require annual contamination monitoring through route audits and cart inspections. A property that fails to provide compliant organics collection, or that lets contamination run high, can face citations on top of the usual hauler costs. Setting up easy, low-contamination food diversion is now the practical baseline.
Source: CalRecycle SB 1383 program | CalRecycle State of Disposal and Recycling
See Property Management Industry Statistics for 2026
Food Waste Statistics 2026: Summary Table
| Statistic | Figure | Source | Year |
|---|---|---|---|
| U.S. surplus food generated | 70 million tons | ReFED | 2024 |
| Surplus food as share of supply | ~29% | ReFED | 2024 |
| Surplus food wasted (not recovered) | ~85% | ReFED | 2024 |
| Total value of surplus food | $380 billion | ReFED | 2024 |
| Value of food actually wasted | ~$325 billion | ReFED | 2024 |
| Wasted food spend per person | $762/year | ReFED | 2024 |
| Year-over-year change in surplus | Down 2.2% | ReFED | 2024 |
| Prior surplus food peak | 74.6 million tons | ReFED | 2019 |
| Household share of surplus | ~33% | ReFED | 2024 |
| Farm share of surplus | 24.2% | ReFED | 2024 |
| Manufacturer share | 18.8% | ReFED | 2024 |
| Food service share | 17.9% | ReFED | 2024 |
| Retail share | 5.7% | ReFED | 2024 |
| Food share of landfilled waste | ~24% | U.S. EPA | 2018 |
| Food share of landfill methane | 58% | U.S. EPA | 2023 |
| Global food lost or wasted | ~1/3 of production | UN FAO | 2024 |
| Food waste share of global GHG | 8-10% | UNEP | 2021 |
| California food waste landfilled | 17-18% of total | CalRecycle | 2026 |
| SB 1383 organics reduction target | 75% by 2025 | CalRecycle | 2025 target |
| SB 1383 edible food recovery target | 20% by 2025 | CalRecycle | 2025 target |
Frequently Asked Questions
How much food does the United States waste each year?
How much is wasted food worth in dollars?
Why is food waste in landfills a problem?
Which part of the food system wastes the most?
Is U.S. food waste getting better or worse?
Methodology and Sources
About This Data
U.S. surplus food, value, and sector figures come from ReFED’s Progress on the Plate: 2026 U.S. Food Waste Report, which models 2024 data, the most recent year available. Landfill composition and methane figures come from the U.S. Environmental Protection Agency, including its 2023 research quantifying methane from landfilled food waste. Global figures come from the UN Food and Agriculture Organization and UN Environment Programme. California figures come from CalRecycle. Each statistic is dated to its source year.
Primary sources:
- ReFED, Progress on the Plate: 2026 U.S. Food Waste Report (2024 data)
- U.S. Environmental Protection Agency, Quantifying Methane Emissions from Landfilled Food Waste
- U.S. Environmental Protection Agency, Advancing Sustainable Materials Management and Food Waste Research
- UN Food and Agriculture Organization and UN Environment Programme Food Waste Index
- CalRecycle, SB 1383 program and State of Disposal and Recycling
Media and press usage: Journalists and publishers are welcome to cite these statistics with attribution to the original primary sources named above and a link to this page. For questions about organics diversion or California SB 1383 compliance, contact Copia Resources.
Request a Quote for Valet Trash and Organics Service